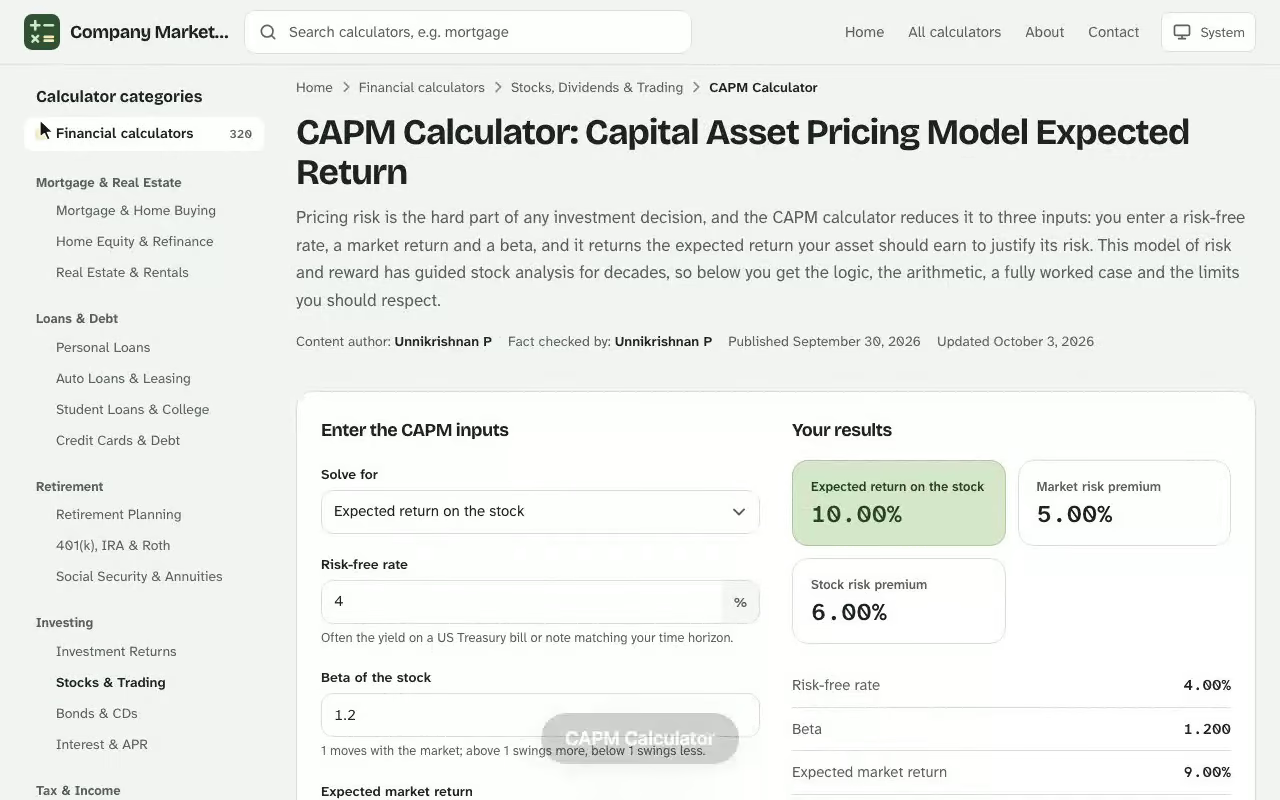
CAPM Calculator. Pricing risk is the hard part of any investment decision, and the CAPM calculator reduces it to three inputs: you enter a risk-free rate, a market return and a beta, and it returns the expected return your asset should earn to justify its risk. This model of risk and reward has guided stock analysis for decades, so below you get the logic, the arithmetic, a fully worked case and the limits you should respect. The free pivot point calculator is free to use with no sign-up, and works on desktop and mobile.
Your results
Expected return on the stock
–
Market risk premium
–
Stock risk premium
–
Risk-free rate–
Beta–
Expected market return–
Expected return on the stock–
CAPM: expected return = risk-free rate + beta × (expected market return − risk-free rate). The result is only as good as the inputs: beta is estimated from past prices and the market return is an assumption.
Expected return at other betas
Points on the security market line for the same risk-free rate and market return.
Beta
Risk premium
Expected return
Results are estimates for educational purposes and are not financial, tax or legal advice.
How the CAPM Calculator Produces an Expected Return
The tool applies a single equation. You supply the risk-free rate, the market return and the beta of the stock or security, and the output is the required return for holding that investment. Everything else on this page explains where those three numbers come from and how to judge the answer. Pair this with the stock constant growth calculator for a fuller picture before you make a decision.
Enter the risk-free rate as a percentage, normally a Treasury yield.
Enter the expected market return, often a long-run index average.
Enter the beta of the asset you are pricing.
Read the expected return and the risk premium it contains.
The Capital Asset Pricing Model Explained
The capital asset pricing model links the return you should demand from a security to the amount of market-wide risk it carries. William Sharpe developed it, and the work earned him a Nobel Prize in 1990. The core idea is simple: investors are paid for bearing risk they cannot diversify away, and for nothing else. A risk-averse investor therefore wants a higher return from a volatile stock than from a government bill, and the model puts an exact number on that gap. The futures and commodities profit calculator online uses the same plain-English approach, so you can compare results side by side.
Because the capital asset pricing model prices only non-diversifiable exposure, two assets with the same beta share the same required return, even when their businesses look nothing alike.
The CAPM Formula, Step by Step
The CAPM formula states that expected return equals the risk-free rate plus beta times the market risk premium:
See how the CAPM Calculator works: change the inputs and the beta updates instantly. Enter your own numbers in the calculator above.
Here \(E(R_i)\) is the expected return on the asset, \(R_f\) is the risk-free rate, \(\beta_i\) is the beta, and \(E(R_m)\) is the expected market return. The bracket \(E(R_m) - R_f\) is the market risk premium. Multiply it by beta and you get the risk premium of the asset; add \(R_f\) and you have the expected rate of return.
Risk-Free Rate
The risk-free interest rate is what a default-free borrower pays you for waiting. In practice you use the yield on a Treasury bill for short horizons, or the 10-year Treasury note for long-term valuation, because a long-term government bond matches the duration of most cash flows better. Pick a maturity and keep it consistent.
Beta and Market Sensitivity
Beta measures how far a stock moves when the market moves. It is the covariance of the asset's returns with the market, divided by the variance of the market's returns. A beta above 1 means high market sensitivity, below 1 means low, and a negative beta means the asset tends to move against the market.
Equity Risk Premium
The equity risk premium is the extra return that stocks as a group are expected to deliver over the risk-free rate. It is the same quantity as the market risk premium: the broad market return minus the risk-free rate.
CAPM Example: A Worked Calculation
This CAPM example uses a stock with a beta of 1.32. Suppose a 3-month Treasury bill yields 4.15% and you expect the market to return 9.35%. First the market risk premium: 9.35% − 4.15% = 5.20%. Then the asset's risk premium: 1.32 × 5.20% = 6.864%. Finally add the risk-free rate:
An investor who requires at least the required rate of return of 11.01% should buy this stock only if their own forecast beats it.
The worked example: a 4.15% risk-free rate plus a 6.86% beta risk premium gives an 11.01% expected return.
Beta Levels and the Expected Return They Imply
Beta is the lever that moves the answer most. Holding the same 4.15% risk-free rate and 9.35% market return, the table shows how the expected return climbs as beta rises.
Beta
Market sensitivity
Expected return
0
None
4.15%
0.60
Low
7.27%
0.90
Slightly below market
8.83%
1.00
Same as market
9.35%
1.75
High
13.25%
2.10
Very high
15.07%
A beta of exactly 1 returns the market return, which is why the market portfolio sits at that point on the chart in the next section.
Expected return across betas and market return forecasts, with the worked example outlined.
The Security Market Line and Your Expected Return
Plot expected return against beta and the security market line appears: a straight line that starts at the risk-free rate where beta is 0, passes through the market portfolio at a beta of 1, and rises with a slope equal to the market risk premium. The intercept is the risk-free return; the slope is 5.20 percentage points per unit of beta in the example above. A stock that offers more than the line says it should is undervalued, and one that offers less is overvalued.
The security market line: expected return rises 5.20 percentage points for each unit of beta.
Checking a Forecast Against the CAPM Required Rate of Return
Marisol runs a small family office and is deciding whether to add a mid-cap industrial stock whose analyst forecast sits at 11.2% a year. Before buying, she wants to know what return the risk justifies, so she opens the calculator.
She gathers three numbers. The 10-year Treasury yield on her screen reads 4.62%, which becomes the risk-free rate. She expects the S&P 500 to deliver 8.90%, based on her own blend of earnings growth and dividends. The stock's five-year monthly beta on Yahoo Finance is 1.17.
Risk-free rate: 4.62
Market return: 8.90
Beta: 1.17
The calculator shows a market risk premium of 4.28%, a stock-specific premium of 5.01% and an expected return of 9.63%. Her family office uses a 10% hurdle for equity positions, so on its face the stock fails the hurdle while the analyst forecast of 11.2% clears the CAPM figure by 1.57 points.
Marisol does not stop there. Beta of 1.17 came from a window that included a volatile year, so she reruns the tool with 1.40, the higher beta published by a second data provider. The required return rises to 10.61%, still below the 11.2% forecast, but the cushion shrinks to 0.59 points. That margin is thin against the 10% hurdle she normally demands.
Her decision is concrete: she buys a half-size position now and sets a rule to add the other half only if the stock's forecast stays above 10.61% after the next quarterly update. The calculation did not make the call for her, but it turned a vague sense that the stock was risky into a number she could test.
Systematic Risk and Unsystematic Risk in the CAPM Model
The CAPM model splits total risk in two. Systematic risk, also called market risk or undiversifiable risk, comes from forces that hit the whole economy, such as recessions and rate shocks. Unsystematic risk, also called specific risk or diversifiable risk, belongs to one company or industry, such as a lawsuit or a supply chain shutdown.
Diversification removes specific risk, so a well-diversified portfolio keeps only the systematic part. This is why beta, and not total volatility, drives the price of risk in the model, and why the risk-return trade-off in the equation is paid only for the exposure you cannot spread away.
From Cost of Equity to WACC and Discount Rate
For a company, the cost of equity is the expected return its shareholders demand, and CAPM is the most common way to estimate it. That figure is the discount rate, or hurdle rate, for free cash flow to equity (FCFE). Free cash flow to the firm (FCFF) is instead discounted at the weighted average cost of capital, or WACC, which blends equity financing with debt. In both cases the cost of capital begins with the CAPM output, so a small change in beta flows straight into a company's valuation.
Who Uses a Capital Asset Pricing Model Calculator in Corporate Finance
Anyone pricing a financial asset needs a defensible hurdle, and that is why a capital asset pricing model calculator shows up in so many workflows. In corporate finance, analysts use it to set the cost of equity before they judge a project, an acquisition or a buyback. Portfolio managers use it as a benchmark: if a holding earns less than the return its beta implies, it is dragging the portfolio down.
Individual investing decisions benefit too. A long-term shareholder comparing two stocks can see at a glance whether the higher forecast return on one is just compensation for a higher beta. Reading risk and return together this way stops you from chasing yield that the capital asset pricing model says is already priced in. Students meet the same logic in introductory finance courses, where the equation is the first bridge between theory and valuation.
The cost of equity from the model also feeds capital budgeting. A new investment is only worth funding when its expected payoff exceeds the equity return investors require, so an overstated beta can kill a good project and an understated one can approve a bad one. That is the practical reason to double-check the three inputs before you trust the answer.
CAPM Assumptions Behind the Expected Return
The model rests on modern portfolio theory and a few strong assumptions:
Efficient markets: prices already reflect public information.
Rational investors: participants are risk-averse and hold diversified portfolios.
One-period horizon: every investor shares the same expectations about returns.
Real behavior departs from these assumptions. Daniel Kahneman's prospect theory contradicts the expected utility theory that CAPM builds on, which is one reason the model draws theoretical and empirical criticism. The Sharpe ratio offers a complementary check, rewarding return per unit of total risk.
Better Inputs for the CAPM Equation
The output is only as good as its inputs. Historical data on the S&P 500 index is the usual proxy for the market return, but a long average can differ sharply from what you expect next year. Look up current Treasury yields for the risk-free rate, and pull beta from a source like Yahoo Finance, or estimate it yourself by regressing the stock's returns on the market's. Treat the result as a range rather than a point: rerun the calculation with a slightly different beta and compare. Check also that the period behind your beta matches your holding horizon, since a beta measured over five years of weekly returns can differ noticeably from one measured over two years of daily returns. Whenever the inputs disagree with common sense, such as a market return below the risk-free rate, fix the assumption before reading the output, because a negative premium would imply that riskier stocks should earn less than a government bill.
Excel Template for the CAPM Formula and Expected Return
Once you grasp the mechanics, an Excel template lets you price a whole watchlist at once with the same CAPM formula this page applies. Give each ticker a row, put the risk-free rate, market return and beta in three columns, and compute the expected return with =Rf+Beta*(Rm-Rf). Use this expected return calculator for a quick single answer and the spreadsheet for batches, then compare each stock's own forecast with the CAPM figure in the last column. For a company-wide view, combine that CAPM output with debt costs to reach the WACC described earlier.
CAPM Calculator questions
What does a CAPM calculator do?
It applies the capital asset pricing model to estimate the return an asset should earn, given the risk-free rate, the expected market return and the asset's beta.
What is the CAPM formula?
Expected return = risk-free rate + beta x (market return - risk-free rate). The bracket is the market risk premium.
What is a good risk-free rate to use?
Most people use a Treasury yield. Short horizons often use a Treasury bill; long-term valuation usually uses the 10-year Treasury note. Keep the maturity consistent with your investment horizon.
How do I find a stock's beta?
Beta is published by most financial data sites. You can also estimate it as the covariance of the stock's returns with the market's returns divided by the variance of the market's returns.
What does a beta above 1 mean?
The stock tends to move more than the market, so the model asks for a higher expected return. A beta below 1 implies lower market sensitivity and a lower required return.
Is the CAPM expected return the same as the cost of equity?
Yes, when applied to a company's shares. The CAPM result is the return equity investors require, which companies use as their cost of equity in valuation and in the WACC.
What are the limits of CAPM?
It relies on assumptions such as efficient markets and rational, risk-averse investors, and on inputs like historical market returns and beta that are estimates. Treat the output as a benchmark, not a prediction.