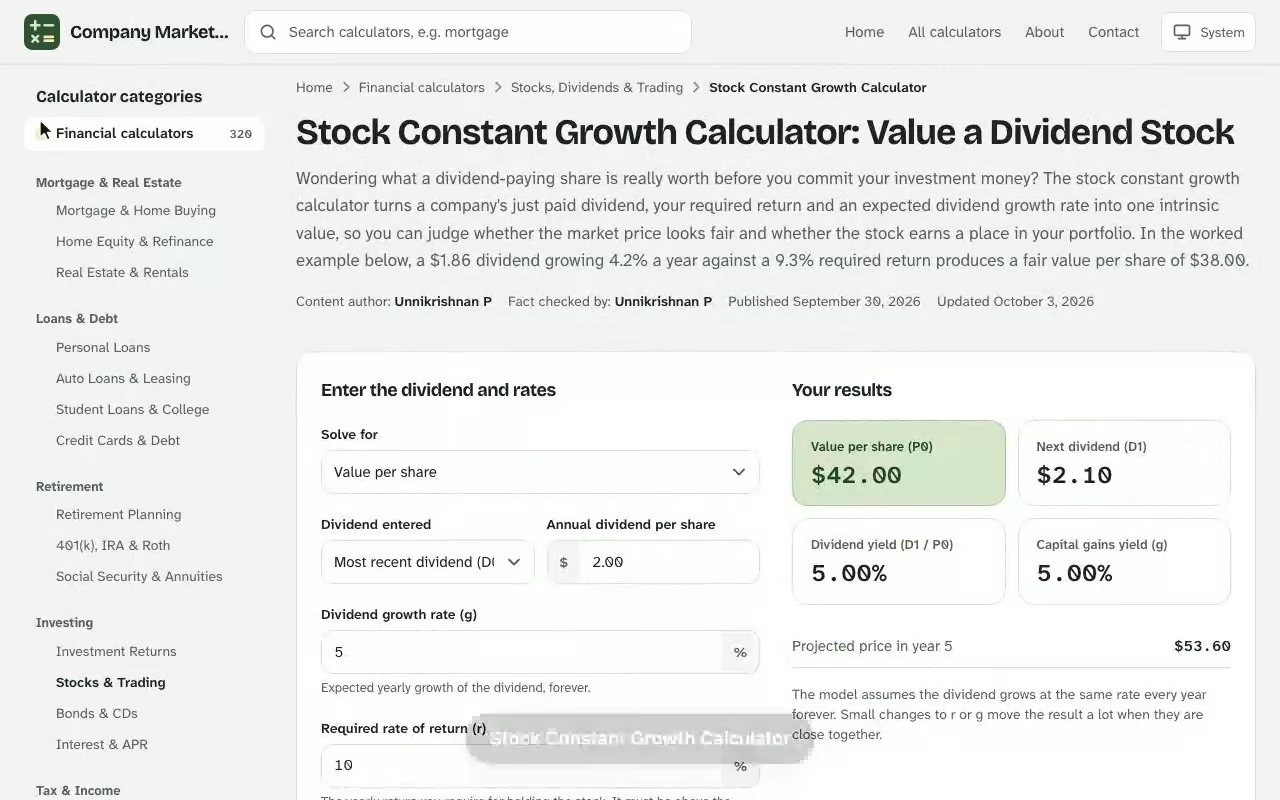
Stock Constant Growth Calculator. Wondering what a dividend-paying share is really worth before you commit your investment money? The stock constant growth calculator turns a company's just paid dividend, your required return and an expected dividend growth rate into one intrinsic value, so you can judge whether the market price looks fair and whether the stock earns a place in your portfolio. In the worked example below, a $1.86 dividend growing 4.2% a year against a 9.3% required return produces a fair value per share of $38.00. The free pivot point calculator uses the same plain-English approach, so you can compare results side by side.
Your results
Value per share (P0)
–
Next dividend (D1)
–
Dividend yield (D1 / P0)
–
Capital gains yield (g)
–
Projected price in year 5
–
The model assumes the dividend grows at the same rate every year forever. Small changes to r or g move the result a lot when they are close together.
Projected dividends and price
Under the constant-growth assumption the dividend and the share price both grow at rate g each year.
Year
Dividend
Total dividends
Price at year end
Results are estimates for educational purposes and are not financial, tax or legal advice.
How the Stock Constant Growth Calculator Values a Share
The calculator applies the Gordon growth model, a special case of the dividend discount model in which every future dividend rises at one unchanging pace. Myron Gordon and Eli Shapiro described the idea in 1956, and it is still the fastest route to a stock valuation for a mature dividend payer. Because the model assumes perpetual growth, the dividend stream that would otherwise run forever collapses into a single fraction, and you can solve it by hand or with the tool in seconds. Next, open the fibonacci retracement calculator online and enter your own details to see an estimate in seconds.
Behind the scenes, the present value of every one of those future dividends is added together, each one discounted back to today at your discount rate. Since the dividends grow at a constant rate, that endless sum has a closed form:
Here P0 is today's fair price, D0 is the dividend the company just paid, D1 is the dividend you expect next, r is your required return and g is the constant annual growth of the dividend.
Next dividend and current dividend
Enter the current dividend (D0) when you know what the company paid over the last twelve months, and the tool grows it by one year to find the next dividend (D1). If you already hold a forecast for next year's payout, enter it directly and skip the growth step. Either way, use annual figures: four quarterly payments of $0.465 become $1.86, not $0.465.
Dividend growth rate and required return
The dividend growth rate is how fast you expect the payout to rise every year, while the required return is the yearly reward you demand for holding the shares. Many an investor sets the required rate of return from a risk-based cost of equity, such as the figure a capital asset pricing model gives them. Every investment decision balances them, and the two inputs pull in opposite directions: raising g lifts the value, raising r lowers it.
Worked Example: Pricing a Stock with the Constant Growth Model
Suppose a regional gas distributor just paid an annual dividend of $1.86 per share. You expect that dividend to grow 4.2% a year and you want a 9.3% return from a stock this exposed to rate changes. The shares trade at a current market price of $44.50. Put those numbers through the constant growth model step by step: The capm calculator online is free to use with no sign-up, and works on desktop and mobile.
Grow the just paid dividend one year: \(D_1 = 1.86 \times 1.042 = 1.9381\).
Subtract growth from the required return: \(r - g = 0.093 - 0.042 = 0.051\).
Divide: \(P_0 = 1.9381 \div 0.051 = 38.00\).
Input or result
Symbol
Value
Current dividend
D0
$1.86
Dividend growth rate
g
4.2%
Required return
r
9.3%
Next dividend
D1
$1.94
Intrinsic stock value
P0
$38.00
Implied dividend yield
r − g
5.1%
Most of the $38.00 intrinsic value comes from dividends paid after year five.
Stock price versus market price
The model-implied price of $38.00 sits $6.50 below the $44.50 quote, so the shares look overvalued by about 17.1% under your assumptions. A stock priced below the model would look undervalued instead. Treat the gap as a prompt for more fundamental analysis, not an order to sell your stocks: the shares may be priced for faster growth than the 4.2% you entered.
Model value against the $44.50 market price at four required returns.
Required return and implied dividend yield
The implied dividend yield equals r − g, here 5.1%, and it matches D1 divided by P0. Run the formula backwards at the $44.50 quote and the market is effectively pricing a return of 8.56% (\(1.9381 \div 44.50 + 0.042\)). For an investment held for income and growth, the capital gain yield, the share of your return that comes from price appreciation, is simply g, or 4.2%. If 8.56% is below what you require, the stock fails your hurdle.
Dividend Discount Model Sensitivity Analysis
A small change in either input moves the answer a lot, which is why every serious sensitivity analysis varies both. The grid below holds the $1.86 dividend fixed and shifts the required return one point either side of 9.3% and the growth rate one point either side of 4.2%.
See how the Stock Constant Growth Calculator works: change the inputs and the required return (r) updates instantly. Enter your own numbers in the calculator above.
Required return
g = 3.2%
g = 4.2%
g = 5.2%
8.3%
$37.64
$47.27
$63.12
9.3%
$31.47
$38.00
$47.72
10.3%
$27.04
$31.77
$38.37
11.3%
$23.70
$27.30
$32.08
Fair value per share across required return and dividend growth rate.
Why a one-point change in growth rate matters
Moving from 4.2% to 5.2% growth at a 8.3% required return lifts the value from $47.27 to $63.12, a jump of 33.5%. The denominator r − g shrinks toward zero, so the result explodes. The inverse relationship runs the other way too: each extra point of required return trims the price, which is the same simulation a spreadsheet performs when it varies r while holding D0 and g constant.
Testing a Utility Stock with the Gordon Growth Model
Dana Whitfield is deciding whether to add a water utility to her retirement account. The shares trade at $62.40, the company just paid $3.12 a year in dividends, and its payout has risen about 2.7% annually. Her own hurdle is 7.6%, a 3.3-point premium over a 4.3% ten-year Treasury yield, so those become the three inputs.
She enters 3.12 as the current dividend, 2.7 as growth and 7.6 as required return, then clicks the calculate button. The tool grows the dividend to $3.20 (\(3.12 \times 1.027 = 3.20424\)), divides by the 4.9% spread and returns a fair value of $65.39. Against the $62.40 quote, that is a 4.8% discount, so the stock screens as modestly undervalued. The same stock valuation run backwards says the market price implies a 7.84% return, 0.24 points above her hurdle.
Before acting, Dana checks the growth input against a ceiling: 2.7% sits comfortably below the roughly 4% nominal growth many analysts assume for the long-run economy, so the constant rate is defensible. Then she stress-tests it. Dropping growth to 2.2% cuts the fair value to $59.05, which is 5.4% below the quote and flips the verdict to overvalued. A single half-point of growth separates buy from wait, so the decision rule becomes concrete: she places a limit order at $59.05 instead of paying $62.40, and revisits her growth estimate after the next two dividend declarations.
Gordon Growth Model Assumptions and Limitations
The formula only makes sense inside a narrow set of conditions. Before trusting any output, check your stock against each of them, because the investment case rests on them. Dividend payers that clear every test give the model its most reliable answers.
The growth rate must be less than required return
When g equals or exceeds r, the denominator hits zero or turns negative, and the model returns an infinite value or a negative one, neither of which means anything. Keep g < r and, in practice, keep long-term growth at or below the economy's pace, since no company can grow its dividend perpetually faster than the economy.
Which stocks fit and which do not
Good fit: mature companies with a stable dividend, such as utilities, consumer staples and blue-chip names with decades of payments.
Poor fit: high-growth companies whose g may exceed r, and any non-dividend paying business, because there is no dividend to grow.
Poor fit: cyclical industries, where payouts swing with the economy rather than rising at a constant rate.
Blind spots: share buybacks, asset sales and any other source of value that never shows up as a dividend.
These limitations explain why value investors use the model as one screen among several in equity valuation, next to cash-flow and earnings multiples, not as a standalone verdict. Its assumptions are simple and transparent, which is exactly why it is worth understanding.
Estimating Dividend Growth for Stock Valuation
The growth input is the hardest number to defend, so build it from evidence instead of optimism. Three routes cover most cases.
Historical dividend CAGR
Take the dividend paid five or ten years ago and the dividend paid now, then compute the CAGR: \((D_{now} \div D_{then})^{1/n} - 1\). A payout that climbed from $1.42 to $1.86 over seven years grew at roughly 3.9% a year. Choose a figure that reflects long-term growth, not a short burst after a one-time increase.
Sustainable growth rate from ROE
The sustainable growth rate equals return on equity multiplied by the retention ratio, the share of earnings a company keeps instead of paying out. A firm earning 12% ROE and retaining 35% of profits can sustain about 4.2% growth: \(g = 0.12 \times 0.35\). That is the logic behind the growth figure in the worked example.
Analyst estimates
Consensus analyst estimates give a forward-looking check on the first two methods. Use them as a cross-check only, since forecasts for the next three years rarely hold for decades.
Using This Stock Calculator for Your Own Valuation
Using the stock constant growth calculator takes four steps. First, enter the current dividend or the next dividend. Second, type the dividend growth rate and your required return as percentages. Third, click the calculate button to see the intrinsic value, the next dividend and the implied dividend yield. Fourth, compare the theoretical stock price with the live quote and ask whether the difference is large enough to matter after taxes and fees.
Because the page works for any dividend payer, the same constant growth stock calculator also solves backwards: given a market price, it returns the required return the market is pricing in, or the growth rate that would justify the quote. That reverse check is often more useful than the headline figure, because it shows the expected return you are being offered on the investment at today's valuation. The result then feeds the next decision, whether this investment deserves more money, and whether to buy, hold, trim or keep waiting for a better entry into other stocks.
Finally, remember that dividends reach shareholders as income, so a stock whose payout is covered by earnings and cash flow carries less risk than one funded by debt. The model rewards dependable dividends, and a steady income stream is the reason it works best for the patient investor rather than short-term traders.
Stock Constant Growth Calculator questions
What is the stock constant growth model?
It values a share as the present value of all future dividends, assuming those dividends grow at one constant rate forever. The result is P0 = D1 / (r - g), also called the Gordon growth model.
What do D0 and D1 mean?
D0 is the dividend the company just paid and D1 is the dividend expected next year. D1 equals D0 multiplied by (1 + g), so you can enter either one.
Why must the growth rate be lower than the required return?
If g equals or exceeds r, the denominator becomes zero or negative and the formula returns an infinite or negative price, which has no economic meaning. The calculator asks you to correct the inputs instead.
Which stocks suit this calculator?
Mature companies with a long, stable dividend record, such as utilities and consumer staples. It is a poor fit for high-growth firms, cyclical businesses and companies that pay no dividend.
How do I estimate the dividend growth rate?
Compute the compound annual growth rate of the dividend over five to ten years, multiply return on equity by the retention ratio, or cross-check with analyst estimates. Pick a rate you can defend for the long term.
What does the implied dividend yield show?
It equals r minus g, which is also D1 divided by the intrinsic value. Comparing it with the stock's actual yield is a quick reasonableness check on your inputs.
How sensitive is the result to the inputs?
Very. A one-point change in the required return or growth rate can move the value by 20% or more, so use the nearby-return table and test several scenarios before relying on one number.