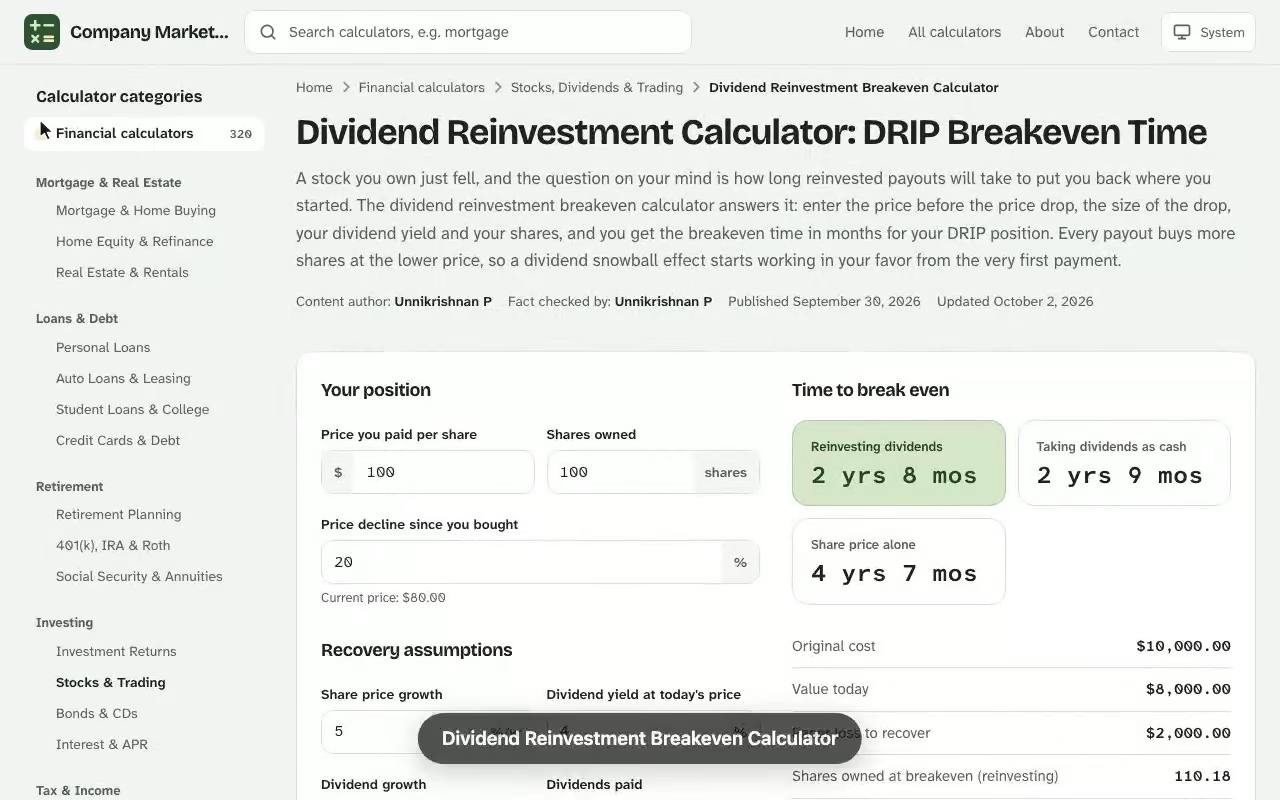
Dividend Reinvestment Breakeven Calculator. A stock you own just fell, and the question on your mind is how long reinvested payouts will take to put you back where you started. The dividend reinvestment breakeven calculator answers it: enter the price before the price drop, the size of the drop, your dividend yield and your shares, and you get the breakeven time in months for your DRIP position. Every payout buys more shares at the lower price, so a dividend snowball effect starts working in your favor from the very first payment. The free pivot point calculator uses the same plain-English approach, so you can compare results side by side.
Time to break even
Reinvesting dividends
–
Taking dividends as cash
–
Share price alone
–
Original cost
–
Value today
–
Paper loss to recover
–
Shares owned at breakeven (reinvesting)
–
Share price at breakeven (reinvesting)
–
Estimated breakeven month (reinvesting)
–
Year-by-year recovery with reinvested dividends
Shown until the position is back to its cost, up to 50 years.
Year
Share price
Shares owned
Dividends reinvested
Position value
Share of cost
Results are estimates for educational purposes and are not financial, tax or legal advice.
How the Dividend Reinvestment Breakeven Calculator Works
A standard dividend reinvestment calculator projects how large a portfolio grows over a set number of years. This breakeven version starts from a different place: a loss that already happened. It asks how many months of reinvesting dividends, combined with a slowly recovering share price, it takes for your holding to be worth what it was before the fall. That is the idea behind dividend reinvestment breakeven, and it is the number a long-term holder actually wants after a bad quarter. Pair this with the position sizing calculator for a fuller picture before you make a decision.
Under the hood, the tool tracks two things month by month: the price per share, which climbs at your expected growth rate from the lower starting point, and your share count, which grows each time a payout is used to buy additional shares. The moment shares multiplied by price reaches your pre-drop value, that month is your breakeven.
Here \(S_{0}\) is the shares you start with, \(P_{pre}\) is the price before the drop, and \(S_{n}\) and \(P_{n}\) are the number of shares and the stock price after \(n\) months. Each payout adds to the share count with a second relationship:
where \(D_{k}\) is the dividend per share paid at payment \(k\) and \(P_{k}\) is the price on that day. A lower \(P_{k}\) means a bigger fraction of a share per payout, which is why a falling price speeds up the compounding rather than only hurting it.
Inputs you enter
Price before the drop and the percentage drop, which together set your starting portfolio value.
Current dividend yield and the expected dividend growth rate, which set the annual dividend per share and how fast it rises.
Expected annual price growth, the price appreciation assumed while you wait for the recovery.
The number of shares you hold and the payment frequency: monthly, quarterly, semi-annual or annual.
An optional annual contribution or monthly purchase if you keep adding to the position.
What the breakeven time tells you
The breakeven time is a distance, not a forecast. It tells you how far the road back is under your assumptions, and a result of 42 months reads very differently from 130 months. Use it to decide whether to keep holding, to add capital, or to question whether the dividend payout is safe at all. The same breakeven calculator logic works for any dividend payer, from a utility to a broad income fund.
Worked Example: Recovering a 27% Price Drop with DRIP
Suppose you own 240 shares bought at $62.40, a position worth $14,976.00. The stock falls 27% to $45.55, so your holding is now worth $10,932.48 and you are $4,043.52 short. It yields 4.6% on the pre-drop price, which is $2.8704 per share per year, or about $688.90 of dividend income in the first year. You assume 3.5% annual price growth, 2.5% dividend growth, and quarterly payments that are all reinvested. The black scholes option calculator is free to use with no sign-up, and works on desktop and mobile.
Because the dividend per share did not change with the price, the yield on your reduced price is now 6.30%, while your yield on cost against the original $62.40 purchase price stays at 4.6%. That gap is the engine behind the recovery.
Reading the recovery timeline
The table is the year-by-year breakdown the calculator produces for this example. Recovery is portfolio value as a share of the $14,976.00 you held before the drop.
See how the Dividend Reinvestment Breakeven Calculator works: change the inputs and the reinvesting dividends updates instantly. Enter your own numbers in the calculator above.
Year
Share price
Shares owned
Portfolio value
Recovery
Start
$45.55
240.00
$10,932.48
73.0%
1
$47.15
255.15
$12,029.30
80.3%
2
$48.80
271.09
$13,228.39
88.3%
3
$50.50
287.87
$14,538.55
97.1%
4
$52.27
305.50
$15,969.28
106.6%
The breakeven lands at month 42, three and a half years in: 296.63 shares at $51.38 each, worth $15,241.00. Your price alone has not recovered by then. The reinvested dividends closed the rest, because your position holds about 56 more shares than when the drop happened.
The dividend reinvestment breakeven recovery curve for the 240-share example: the gap closes at month 42.
DRIP vs Taking Dividends in Cash
The natural comparison is the same stock with the payouts taken as cash. The calculator shows both lines so you can see what the drip strategy adds, using the same inputs as above and counting the cash received as part of your total.
Milestone
With DRIP
No DRIP (cash)
75% recovered
Month 5
Month 5
90% recovered
Month 27
Month 30
Full recovery
Month 42
Month 45
Shares at full recovery
296.63
240.00
The advantage is three months of waiting, not a miracle, and it is small early because few shares have been added yet. It widens with every year after breakeven, which is the real payoff of the dividend snowball. If you need the money to pay bills, taking cash is a perfectly good choice, and the no DRIP column shows you what that costs in time.
Dividend Reinvestment Results: Ending Balance, Total Return and Compound Growth
The breakeven month is only one line of what a dividend reinvestment calculator reports. Keep the same inputs running and the ending balance after ten years invested is $27,717.28, from 431.36 shares at $64.26. Measured against the $14,976.00 you held before the fall, the total return is 85.08%, a return rate of 6.35% per year. Measured against the $10,932.48 you were left with after the drop, the same ten years work out to 9.75% per year, and that second figure is why a drawdown that looks painful can still produce a strong stretch of portfolio growth for whoever keeps reinvesting.
The engine behind those numbers is compound growth. Each of your dividend payments is used to buy more shares, those shares earn their own payouts, and the compounding effect speeds up every year because the base keeps getting bigger. A payout that arrives annually compounds in bigger, less frequent steps, while one that arrives monthly compounds in many small ones. Both rely on the payout staying sustainable, meaning the company earns enough to keep funding it without borrowing.
When you compare outcomes, look at three numbers together rather than one: the breakeven month, the ending balance and the total return. A position can break even quickly and still end up far behind another, and the reverse is also true. For most dividend stocks held through a long recovery, the ending balance is the number that tells you whether staying put was worth the wait.
What Moves Your Dividend Reinvestment Breakeven
Holding every other input at the example values, here is how single changes shift the breakeven for the 240-share position with DRIP switched on.
Change
Months to breakeven
Price drop of 15% instead of 27%
24
Monthly payments instead of quarterly
40
Base example (27% drop, 4.6% yield, quarterly)
42
Annual payment instead of quarterly
48
Dividend yield of 3.0% instead of 4.6%
52
Price drop of 40% instead of 27%
58
Breakeven time by scenario: price drop depth and dividend yield move the result most.
Depth of the price drop
The size of the fall dominates everything else. A deeper drop leaves a bigger hole and so takes longer, yet it also raises the yield on what you now hold, so the extra recovery time is not proportional. A 40% fall takes 58 months, not the roughly 62 you would get by scaling the 27% case.
Dividend yield and yield on cost
A higher dividend yield means a larger fraction of a share per payment. Cutting the yield from 4.6% to 3.0% adds ten months. A high yield deserves a second look, though: a very high yield after a fall can be a signal that the market expects the payout to be cut.
Payment frequency and distribution frequency
The distribution frequency matters less than most people expect. Moving from annual to monthly payments saves eight months here, because cash gets put to work sooner. If you can choose between two otherwise identical holdings, more frequent payments help, but never at the cost of a lower yield.
Dividend growth against price appreciation
Both rates help the recovery, in different ways. Price appreciation lifts every share you own, while dividend growth makes each future payout buy more. In a flat or low growth market the payout carries most of the load, which is why the DRIP column in the calculator separates the two effects.
Dividend Stocks, ETFs and Mutual Funds Suited to a Dividend Reinvestment Plan
A dividend reinvestment plan only recovers a loss if the payout survives the downturn. Many investors pick dividend stocks from mature companies with steady earnings and sound balance sheets, since those stocks tend to hold their payments through a market correction, while a young company paying out most of its profit rarely does. A blue chip name with decades of increases is the classic example. Each investment you add to a plan should pass the same test: could the business keep paying if sales fell for two years?
The vehicle you hold decides which yield and growth rate you can reasonably enter into the calculator. A single stock's payout can be cut outright, while a basket of stocks inside a fund usually blends that risk. Check the payout record before you enter a yield, because a breakeven result built on a payout that is about to be cut is worthless.
Payout ratio: the share of earnings paid out. A modest payout ratio leaves room to keep paying when profit dips, and a ratio at or above 100% is a warning.
Dividend aristocrats and dividend kings: companies with 25 and 50 consecutive years of increases. Their record is evidence of resilience, not a guarantee.
ETF and mutual funds: the distribution record of an ETF or of mutual funds that own many dividend payers feeds your yield and growth inputs, and most brokers let you reinvest the distributions automatically.
Company performance: falling sales or rising debt behind a price drop mean the numbers you enter for dividend growth may be too hopeful.
Before you enter a yield, shortlist dividend stocks or a broad dividend ETF, compare how each held its dividends in the last downturn, and use that record, not the headline yield, as your input. Reinvested dividends from an ETF behave like those from single stocks, and a low-fee ETF keeps more of the income working in the calculation. Two ETFs that track different indexes can overlap heavily, so check what each ETF owns before you run them as separate scenarios. Many investors hold ETF positions for steady dividends and a few stocks they understand, then test each investment in the tool on its own. A tax check belongs in that routine too, since an ETF held in a retirement account avoids tax drag on every payout.
The biggest threat to any recovery plan is dividend cuts. If the payout is halved, your breakeven time grows sharply, and it is wise to rerun the numbers with a lower yield before you trust a short result. The risk is real even for well-known names, so check the payout against what the business earns.
Dividend Reinvestment for Long-Term Investors: When the Stock Price Recovers
The calculator assumes a smooth climb, but the stock price never moves in a straight line, and for most stocks the order of good and bad years changes what happens to your dividends. Suppose the price slips another 10% in the first year. Your reinvested payouts then buy shares at an even lower cost, which lifts the annual dividend you will receive on the larger position and shortens the later part of the recovery, though the starting loss is deeper. Suppose the price instead jumps early: you buy fewer shares, and the plan leans on price growth rather than on the snowball.
Because stocks rarely follow the assumed path, experienced investors read the breakeven result as a range. They enter an optimistic growth rate, a flat one and a pessimistic one, and note how much of the recovery depends on each. If the answer is that the plan only works with strong price growth, the stock is a growth bet, not an income investment. If it still breaks even at zero growth, the dividend is doing the work, which is the case where the strategy is strongest.
The mix of holdings shapes how reliable your payout assumptions are. Dividend stocks in defensive sectors usually keep paying dividends through a slump, while cyclical stocks often trim dividends first, so use a more cautious assumption for the cyclical ones and rerun the calculator to see how much later the breakeven arrives. Sort your holdings by how stable their dividends have been before you trust a recovery estimate.
Your own capital matters too: a long breakeven time is easy to sit through when the holding is a small slice of your portfolio and hard to sit through when it is most of your savings, so compare the result with the date you will need the money.
Using the Dividend Reinvestment Calculator on a Utility Holding After a 19% Slide
Marguerite holds 410 shares of a regulated utility she bought at $38.15, a $15,641.50 position. A rate scare knocks the price down 19% to $30.90, leaving $12,669.62. She plans to start drawing income in about three years, so before deciding whether to sell, she opens the dividend reinvestment calculator and works out the dividend reinvestment breakeven for the position.
She enters $38.15 as the pre-drop price, a 19% drop, 410 shares and quarterly payments. The dividend is $1.9838 per share a year, a 5.2% yield on her purchase price, and she assumes 1.5% dividend growth and 2% annual price growth, deliberately below the utility's recent pace. She leaves reinvestment switched on and clicks the calculate button.
Result
Value
Breakeven time
33 months
Shares at breakeven
487.12 (77.12 added)
Price at breakeven
$32.63
Value at breakeven
$15,895.26
Thirty-three months sits inside her 36-month window, with three months of room. The result also tells her something about the plan: the share price at breakeven is still $5.52 below her purchase price, so dividends, not a rebound, close the gap. That makes the payout the thing to check. The company's payout ratio is 68%, under the 75% line she treats as a cut warning, so she keeps holding.
Her next action is a stress test. She reruns the calculator with the yield halved to 2.6%, the equivalent of a 50% dividend cut, and the breakeven stretches to 51 months, well past her window. She writes that figure down as her trigger: if the utility announces a cut, she sells, because the recovery would no longer fit her timeline.
Taxes, Cost Basis and Dollar-Cost Averaging with Reinvested Dividends
Reinvested payouts are still taxable income in a regular brokerage account, so taxes take a slice before you buy anything. In the United States, qualified dividends are taxed at 0%, 15% or 20% depending on your income, and the tax rate you enter shrinks the amount reinvested each period. Some countries use a tax-exempt allowance below which payouts are not taxed at all, so enter your own figures. Inside a retirement account the question mostly disappears, and the unadjusted result is the right one.
Every reinvestment is a new purchase, which changes your cost basis. Because each payout buys shares at whatever the price happens to be, you are practicing dollar-cost averaging without lifting a finger: fewer shares when the price is high, more when it is low. Over the years that brings your average cost per share down below your original purchase price, which matters when you eventually sell.
Whether you care about wealth building for retirement or a steady income stream, a higher tax rate lengthens the breakeven time because less of each payout is reinvested, and long-term investors with a long investment horizon can afford to run that input both ways. Volatility is easier to live with when each dip buys you more of the stock.
Limits of Any Dividend Calculator or DRIP Calc
A dividend calculator turns your assumptions into projections, and a projection is only as good as its inputs. The expected growth and yield are hypothetical, a split or a spin-off can change your starting principal in one day (a stock split changes the share count, not your value), and nothing here accounts for the stock market falling further. Similar tools such as the DRIP Calc and the DRIP returns calculator projections you may have seen online show growth over a fixed number of years, while this one solves for the time to recover.
Treat the result as a planning aid for investors, not a promise. Real market conditions will differ from a smooth growth line.
Rerun the dividend reinvestment calculator with a pessimistic case: lower price growth, a trimmed yield and a worse market downturns scenario.
Remember that the figures are for educational purposes. Speak with a financial advisor before acting, since this is not investment advice.
Used that way, the dividend reinvestment breakeven calculator gives you something a plain growth projection does not: a clear, testable answer to how long until you are whole again.
What is a dividend reinvestment breakeven calculator?
It estimates how many months it takes a stock position to get back to its value before a price drop when every dividend is used to buy more shares. The result depends on the size of the drop, the dividend yield, dividend growth and how fast the share price recovers.
How does dividend reinvestment help me recover from a price drop?
A lower price means each dividend buys more shares, and those extra shares earn their own dividends. This dollar-cost averaging effect lowers your average cost and shortens the recovery compared with taking the dividends as cash.
Which inputs change the breakeven time the most?
The depth of the price drop moves the result most, followed by the dividend yield and the expected share price growth. Payment frequency matters less, because more frequent payments only put cash to work a little sooner.
What happens to the breakeven time if the dividend is cut?
It lengthens, often sharply, because fewer shares are added each period. Rerun the calculator with a lower yield to test how a cut would change your timeline before you rely on a short result.
How do taxes affect the result?
Tax is taken from each dividend before it is reinvested, so a higher dividend tax rate means fewer new shares and a longer breakeven. Enter your own rate, and the yearly allowance if your country exempts some dividend income.
Does additional investing speed up the breakeven?
New money is excluded from the breakeven comparison so that it cannot hide an unrecovered loss. It still raises the ending balance and the dividend income shown in the results.
What does yield on cost mean?
Yield on cost is the annual dividend divided by what you originally put in, including any additional investments. It rises over time as the dividend grows and as reinvestment adds shares.
How accurate are the projections?
They are estimates built from your assumptions, with smooth price growth and steady dividend growth. Real prices and payouts vary, so treat the result as a planning aid and not as investment advice.