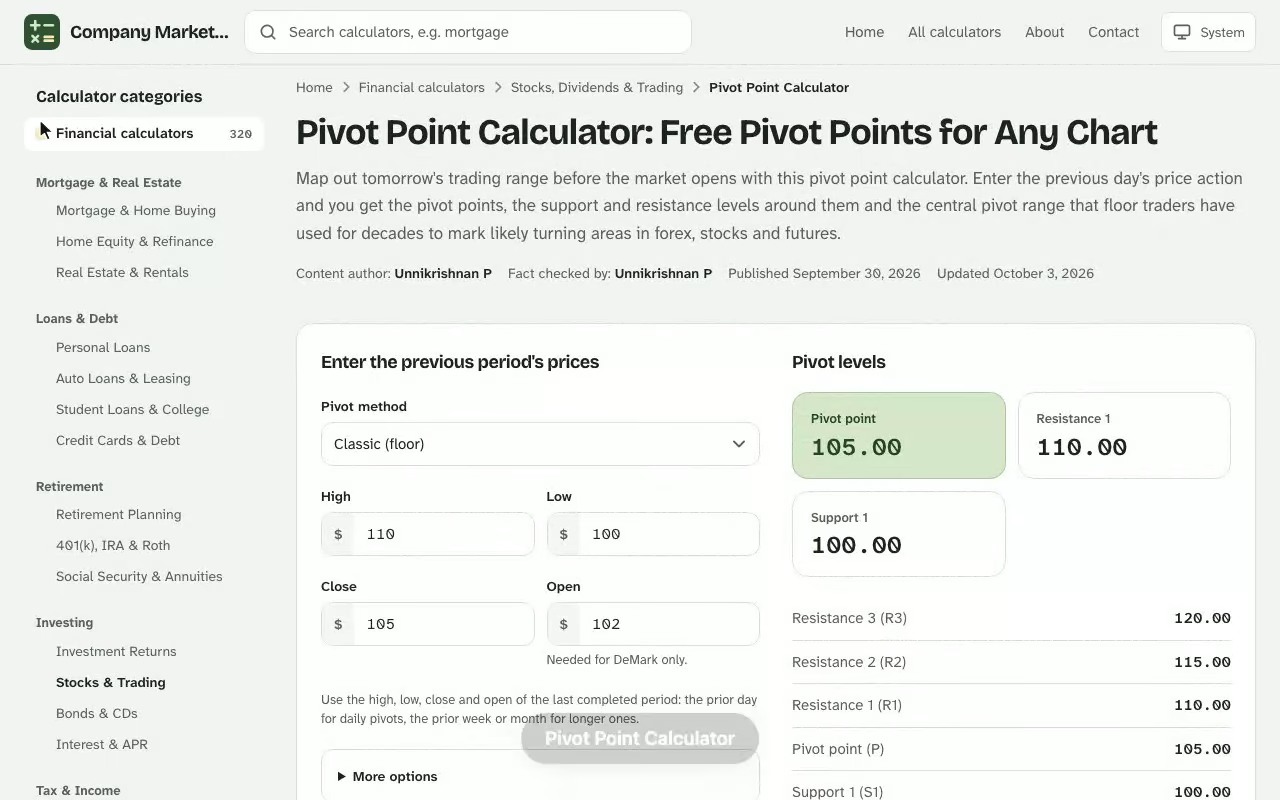
Pivot Point Calculator. Map out tomorrow's trading range before the market opens with this pivot point calculator. Enter the previous day's price action and you get the pivot points, the support and resistance levels around them and the central pivot range that floor traders have used for decades to mark likely turning areas in forex, stocks and futures. The compound interest calculator online uses the same plain-English approach, so you can compare results side by side.
Pivot levels
Pivot point
–
Resistance 1
–
Support 1
–
Resistance 4 (R4)
–
Resistance 3 (R3)
–
Resistance 2 (R2)
–
Resistance 1 (R1)
–
Pivot point (P)
–
Support 1 (S1)
–
Support 2 (S2)
–
Support 3 (S3)
–
Support 4 (S4)
–
All methods compared
The same prices run through each method. A dash means the method does not define that level.
Level
Classic
Woodie
Camarilla
Fibonacci
DeMark
Results are estimates for educational purposes and are not financial, tax or legal advice.
How a Pivot Point Calculator Finds Support and Resistance Levels
A pivot point is an average of the previous trading session's prices. The pivot point (PP) sits in the middle, and every other level is projected above or below it using the same session's range. Levels above PP are resistance, where an advance tends to stall, while levels below it are support, where a decline tends to slow. Because the inputs are known before the next session starts, the whole ladder can be drawn on a chart in advance.
These price levels matter for one reason: so many participants watch them. When thousands of orders cluster around the same numbers, the levels can become self-fulfilling, which is why a pivot point indicator often shows visible reactions even though it is built from nothing more than arithmetic.
Support and resistance levels you get back
The tool returns up to nine rungs: R1, R2, R3 and R4 above the pivot, S1, S2, S3 and S4 below it. R1 and S1 are the nearest and most frequently tested, R2 and S2 mark a stretched move, and R3 and S3 flag a session that has broken out of its normal range.
Central pivot range (CPR)
Alongside the ladder, the central pivot range is built from three values: the pivot itself, the bottom central pivot (BC) and the top central pivot (TC). A narrow gap between BC and TC hints at a trending day, while a wide gap points to range-bound trade.
Pivot Point Calculator Inputs and Results
The form needs four numbers from the previous day or any other period you want to analyse. Everything else is a choice about how many decimal places to display and which formula set to apply. If you want to see how the figures change, the investment loan calculator online gives you an instant result you can adjust as you go.
Open: the first price of the period, used by the DeMark and Woodie variants.
High: the highest price traded in the period.
Low: the lowest price traded in the period.
Close: the final price of the period, which is the most heavily weighted input.
Decimal places: two for stocks and indices, four or five for most currency pairs.
How to use the pivot points calculator
Type the open, high, low and close, choose a formula set and click the Calculate button. The pivot points calculator then lists PP, R1 to R4, S1 to S4 and the CPR values for Classic, Fibonacci, Woodie, Camarilla and DeMark methods side by side, so you can compare them before drawing anything.
Check your open, high, low and close against your broker's data before you calculate: one mistyped digit shifts the entire ladder.
Which timeframe to use
The timeframe of your inputs is the timeframe of your levels. Use the previous day for intraday trading, the previous week for swing trading and the previous month for longer-term maps. A daily high low close feeds the next session's levels; a weekly set feeds the next week's.
Pivot Points Formulas for Every Level
Every method begins with a central value and builds the ladder outward. The widely published pivot point formula, used by the Classic set, is the average of the three closing-type prices: If you want to see how the figures change, the stock option calculator gives you an instant result you can adjust as you go.
$$PP = \frac{High + Low + Close}{3}$$
The first support and resistance pair reflects the pivot through the opposite extreme, and the second pair adds or subtracts the full session range:
Worked pivot point formula with R1 and S1 from the same session.See how the Pivot Point Calculator works: change the inputs and the pivot point updates instantly. Enter your own numbers in the calculator above.
Classic pivot points
Classic pivot points are the original floor-trader version shown above. They are the easiest to verify by hand and the set most trading books teach first.
Fibonacci pivot points
Fibonacci pivot points keep the same PP but scale the range by retracement ratios: \(R1 = PP + 0.382 \times Range\), \(R2 = PP + 0.618 \times Range\) and \(R3 = PP + 1.0 \times Range\), with supports mirrored below. Technical analysis users like them because the levels line up with Fibonacci retracements drawn on the same chart.
Woodie pivot points
Woodie pivots weight the close twice, so \(PP = \frac{High + Low + 2 \times Close}{4}\). The result shifts the whole ladder toward where the session actually finished.
Camarilla pivot points
Camarilla pivot points pack the levels tightly around the close using \(Close \pm Range \times 1.1 / 12\), \(/ 6\), \(/ 4\) and \(/ 2\) for the first through fourth rungs. Short-term traders favour them for fading moves at R3 and S3 and for breakout entries beyond R4 and S4.
DeMark pivot points
Demark pivots choose their starting value by comparing the open and close: a lower close uses \(High + 2 \times Low + Close\), a higher close uses \(2 \times High + Low + Close\), and an unchanged session uses \(High + Low + 2 \times Close\). Only one resistance and one support level are produced, which keeps the output focused.
Worked Example with Pivot Levels
Take a stock index futures contract that traded these values yesterday: open 5,842.25, high 5,871.50, low 5,818.75 and close 5,859.00. The session range is 5,871.50 − 5,818.75 = 52.75 points.
The pivot is (5,871.50 + 5,818.75 + 5,859.00) / 3 = 5,849.75. Plugging that into the formulas gives the following pivot levels:
Level
Classic
Fibonacci
R3
5,933.50
5,902.50
R2
5,902.50
5,882.35
R1
5,880.75
5,869.90
PP
5,849.75
5,849.75
S1
5,828.00
5,829.60
S2
5,797.00
5,817.15
S3
5,775.25
5,797.00
Classic support and resistance levels spaced by price around the pivot.
Reading the central pivot range
For the same session, BC = (5,871.50 + 5,818.75) / 2 = 5,845.13 and TC = 2 × 5,849.75 − 5,845.13 = 5,854.38. The CPR is only 9.25 wide, well under a fifth of the range, which suggests the next day could trend rather than chop sideways.
Comparing the methods
Classic spreads its levels widest, Fibonacci sits closer to the pivot, and Camarilla stays hugged to the close. Woodie shifts the entire ladder a little higher here because the close finished near the top of the range.
Fibonacci pivots sit closer to the pivot than Classic at every rung.
Planning a Gold Futures Session with a Free Pivot Point Calculator
It is Sunday evening and a gold futures trader wants a plan for Monday before the screens get noisy. Friday's session printed an open of 2,318.40, a high of 2,341.60, a low of 2,309.20 and a close of 2,336.80, so those four numbers go into the calculator with two decimal places selected.
After the Calculate button is clicked, the pivot points appear: PP at 2,329.20 from (2,341.60 + 2,309.20 + 2,336.80) / 3. The range is 32.40, which gives these Classic levels:
Level
Price
R2
2,361.60
R1
2,349.20
PP
2,329.20
S1
2,316.80
S2
2,296.80
Friday's close of 2,336.80 finished 7.60 above PP, so the bias for the open is bullish. R1 at 2,349.20 sits just under the 2,350.00 round number that many desks treat as a psychological barrier, which makes it a sensible first target rather than R2.
The plan writes itself from the ladder. If gold dips back to PP at 2,329.20 and holds, the trader buys there with a stop at 2,316.80, just beneath S1, risking 12.40 points to make 20.00 at R1. That is a 1.61 reward-to-risk ratio, above the 1.5 minimum written into this trader's rules, so the trade qualifies. Had the ratio come out lower, the next step would be rerunning the numbers with the Fibonacci set, whose R1 would sit closer to price, or skipping the setup altogether.
Reading Pivot Points Across Forex, Stocks and Futures
The maths does not care what the instrument is, which is why a pivot calculator works on forex pairs, stocks, indices, futures, commodities, options underlyings and even bonds. What changes is the liquidity of the market and where its day begins and ends.
Forex pivot points
Currency trades around the clock, so a forex pivot point calculator needs a cut-off. Many traders use the 5 p.m. New York close; others use the London or Asian session. Choose one and apply it consistently.
Stock and index pivot levels
For stocks and indices, the previous regular session supplies the high, low and close. Thin names can gap through levels at the open, so check volume before trusting a nearby support or resistance line.
Futures and commodities
Futures such as oil and gold have deep liquidity and clear settlement prices, which makes their pivot levels widely watched. Use the settlement price as the close for consistency with other participants.
Using Pivot Points for Day Trading and Swing Trading
A level only becomes a plan when you attach an action to it. Most trading strategy rules built on pivots fall into three families.
Range trading
When price opens between S1 and R1 and the CPR is wide, traders look to buy near support and sell near resistance, fading the edges of the range back toward PP.
Breakouts
A decisive close beyond the calculated R1 or S1 on rising volume signals that the range is giving way. Breakouts often target the next level, and a stop-loss tucked back inside the old range keeps the risk defined.
Reversals and retracements
If price tags R2 or S2 on your calculated ladder and prints a rejection candle, price action traders treat it as a possible reversal. Pairing the level with a Fibonacci retracement from a recent swing improves confluence.
Entry, exit and take-profit planning
Use the nearest level as your entry reference and the next one as your take-profit.
Place a stop-loss a few ticks beyond the level that would invalidate the idea.
Plan your exit before you enter, using the pivot as a midpoint target on pullbacks.
Read price relative to PP: above is bullish bias, below is bearish.
Market sentiment and swing trading
Weekly and monthly sets help swing trading too. Enter the previous week's high, low and close into the calculator and the weekly PP follows; when price holds above it, it hints at positive market sentiment for the whole week, and closes below it suggest the opposite.
Limits of the Pivot Point Indicator
Pivots are a guide, not a forecast. They ignore news, volatility spikes and earnings, and a session that already moved beyond R3 or S3 has left the ladder behind. A pivot levels calculator supplies the numbers, but the pivot point levels still need trend, volume and risk management rules around them rather than trading every touch, and remember that the most useful levels are the ones that coincide with other support or resistance on the chart.
Choosing the right formula set
No set is universally best, so select the matching formula option in the calculator before you copy any numbers. Classic suits beginners, Fibonacci suits those who already trade retracements, Camarilla suits tight intraday setups, and Woodie or DeMark suit those who value the open or close more heavily. Test each against a month of your own chart history before committing.
Plotting the ladder on your chart
Once you calculate the levels, draw PP, R1 to R4 and S1 to S4 as horizontal lines on an intraday chart, with resistance in one colour and support in another. Replace the set each evening so stale lines never clutter the chart, and compare each line with earlier swing highs and lows, since a level that matches a prior turning point on the chart is worth more than one floating alone.
Pivot Point Calculator questions
What is a pivot point calculator?
It turns the previous period's open, high, low and close into a central pivot point plus support and resistance levels, so you can mark likely turning areas on a chart before the next session starts.
How do you calculate a pivot point?
The classic pivot point is the average of the high, low and close: PP = (High + Low + Close) / 3. Resistance and support levels are then projected from PP using the previous range.
Which pivot point formula set should I choose?
Classic is the most widely used and a good starting point. Fibonacci scales the range by retracement ratios, Camarilla packs levels tightly around the close, Woodie weights the close more heavily and DeMark uses the open-versus-close relationship. Test each on your own charts.
Which prices should I enter for forex, stocks and futures?
Use the previous session's high, low and close. Forex trades around the clock, so pick one daily cut-off, such as the New York close, and use it consistently. For futures, many traders use the settlement price as the close.
What timeframe should I use?
Use the previous day for intraday levels, the previous week for swing trading and the previous month for longer-term levels. The timeframe of your inputs is the timeframe of your levels.
How are pivot points used in trading?
Traders watch the levels for bounces, rejections and breakouts, set stop-loss and take-profit orders around them, and treat price above PP as a bullish bias and below it as bearish.
What does the central pivot range show?
The central pivot range is the zone between the bottom central pivot (BC) and top central pivot (TC). A narrow range hints at a trending session; a wide one suggests range-bound trading.
Are pivot points guaranteed to work?
No. They are a planning aid built from past prices, so combine them with trend, volume and risk management rules rather than trading every touch.