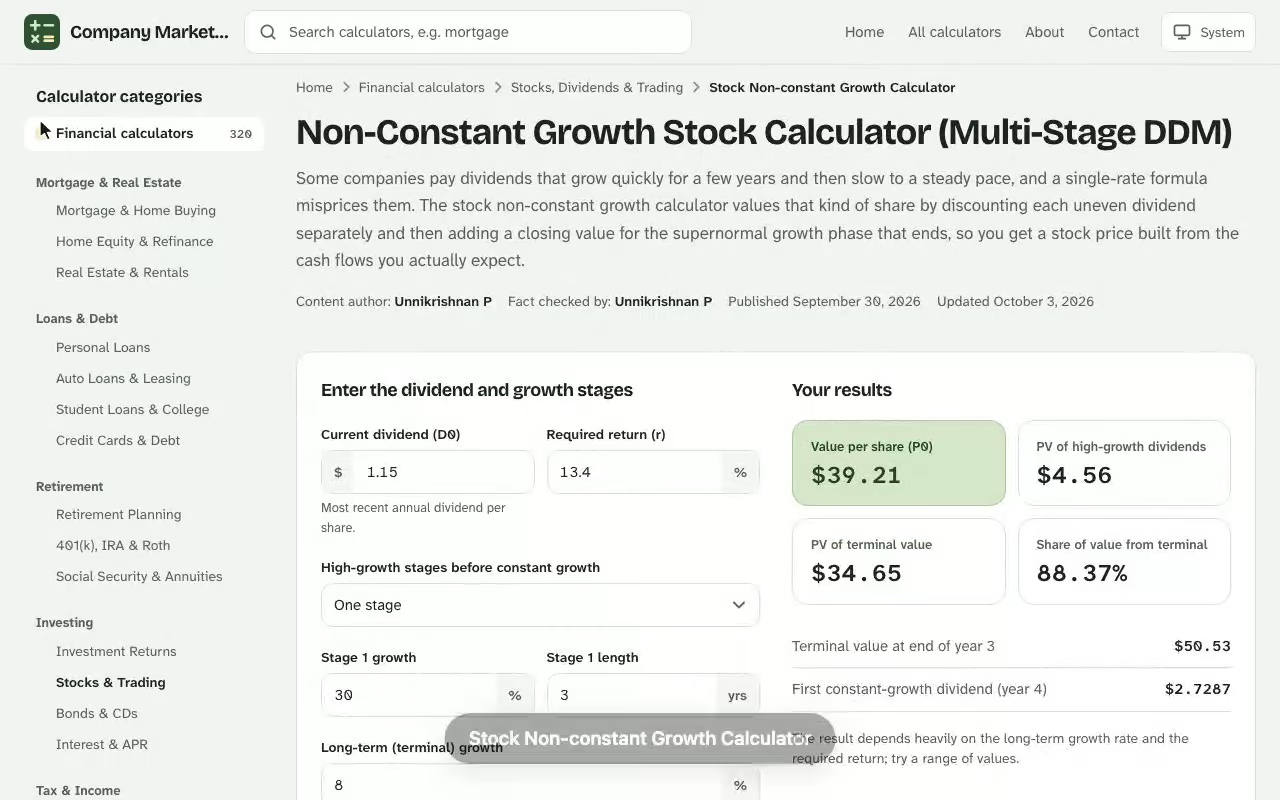
Stock Non-constant Growth Calculator. Some companies pay dividends that grow quickly for a few years and then slow to a steady pace, and a single-rate formula misprices them. The stock non-constant growth calculator values that kind of share by discounting each uneven dividend separately and then adding a closing value for the supernormal growth phase that ends, so you get a stock price built from the cash flows you actually expect. Next, open the pivot point calculator online and enter your own details to see an estimate in seconds.
Your results
Value per share (P0)
–
PV of high-growth dividends
–
PV of terminal value
–
Share of value from terminal
–
Terminal value at end of year 3
–
First constant-growth dividend (year 4)
–
The result depends heavily on the long-term growth rate and the required return; try a range of values.
Dividends and present values
Each dividend is discounted back to today at the required return. The last row is the terminal value: the constant-growth value of all later dividends, at the end of the final high-growth year.
Year
Growth
Dividend
Discount factor
Present value
Results are estimates for educational purposes and are not financial, tax or legal advice.
What a Stock Non-Constant Growth Calculator Values
A non-constant growth stock is one whose dividends do not expand at one fixed percentage forever. A young payer may raise its payout 16% a year while it scales, then 11% as the business matures, then settle near the pace of the broader economy. The nonconstant growth stock model respects that path: it treats the early years as individual forecasts and only applies perpetual growth after the pattern stabilises. Try the stock return and capital gain calculator to run your own numbers — everything is calculated in your browser and nothing you enter is stored or sent anywhere.
That makes the growth stock calculator approach a practical version of the dividend discount model. Rather than guessing one average, you tell the model the dividend growth rates for each explicit year and the constant growth rate that follows. Investors, analysts and students use it for equity valuation whenever a company's payout policy is clearly in transition.
Why one growth rate is not enough
Averaging a 16% sprint and a 4.5% long-run rate into a single number understates the early cash and overstates the late cash. Because the final stage carries most of the present value, a small distortion there moves the answer a lot, so the calculator keeps each stage separate.
Inputs the Nonconstant Growth Stock Calculator Needs
The nonconstant growth stock calculator asks for a handful of numbers. Each one maps to a term in the valuation, so it helps to know what you are entering before you click the calculate button. If you want to see how the figures change, the market cap growth calculator gives you an instant result you can adjust as you go.
Current dividend (D0): the just paid dividend, the most recent annual payout per share.
Dividend growth rate for each explicit year: the expected yearly increase while growth is unusual. Enter one row per year.
Normal dividend growth rate: the rate used once growth becomes steady, entered on the last row.
Required return, also called the required rate of return or cost of equity: the annual stock return you demand for owning the shares.
Choosing the required return on the stock
The required return on the stock is the discount rate applied to every future cash flow. Build it from a risk-free yield plus a premium for equity risk, then keep it above the steady growth rate, because the model requires r > g to produce a finite fair value.
Estimating how long the fast phase lasts
The number of explicit rows you enter in the calculator equals the length of this stage, the N in the formula. Choose it by asking how long the company can keep reinvesting at high returns before competition, size or regulation pulls payout growth back toward the steady rate; three to ten rows is a common window. A stage that ends before growth has actually cooled hands the terminal value an inflated starting point, while a stage that runs too long inflates every later dividend, so shorten it whenever the evidence is thin. With the rows set, the tool lets you calculate the price in a single pass instead of rebuilding a spreadsheet each time you revise a forecast.
Non-Constant Growth Formula and the Gordon Growth Model
The formula splits the valuation into two pieces: the explicit dividends and a terminal value found with the Gordon growth model. For N explicit years, the theoretical stock price today is:
Here \(D_t\) is the dividend in year t, \(r\) is the required return, and \(g\) is the steady rate after year N. The second term is the constant growth model applied at the end of the explicit stage, then discounted back. A plain constant growth calculator uses only that second term from day one, which is why it suits a constant growth stock but not a company still changing gears.
Step-by-step calculation
Grow the current dividend by each year's rate to get D1 through DN.
Discount each of those future dividends at the required return.
Compute the next dividend after the explicit stage, DN+1, using the steady rate.
Divide DN+1 by (r − g) to get the terminal value, then discount it back N years.
Add the discounted dividends and the discounted terminal value.
Worked Example: Supernormal Growth, Then Constant Growth
Take a company whose current dividend is $1.37 per share. You expect the dividend to rise 16% in year one, 16% in year two and 11% in year three, after which it settles at a steady 4.5%. Your required return is 9.5%.
Year
Growth rate
Dividend
Discount factor
Present value
1
16%
$1.59
0.9132
$1.45
2
16%
$1.84
0.8340
$1.54
3
11%
$2.05
0.7617
$1.56
Sum of explicit dividends
$4.55
Dividend path for the worked example, from the just paid dividend to the first steady-growth year.
The next dividend in year four is $2.05 × 1.045 = $2.14. The terminal value at the end of year three is $2.14 ÷ (0.095 − 0.045) = $42.77, and discounting it three years at 9.5% gives a present value of $32.57. The calculator adds the two pieces for a model stock price of $37.12.
See how the Stock Non-constant Growth Calculator works: change the inputs and the value per share (p0) updates instantly. Enter your own numbers in the calculator above.
Notice that the terminal piece supplies about 88% of the total. That is typical for any dividend discount model with a long horizon, and it is the reason the steady rate deserves the most scrutiny.
How the three explicit dividends and the terminal value add up to the model price.
Reading the Result: Intrinsic Value Versus Market Price
The output is an intrinsic value, sometimes called intrinsic worth: what the shares are worth if your dividend path and discount rate are right. Compare it with the market price. If the quote is well below $37.12, the shares look undervalued under your assumptions; if it is well above, they look overvalued. The model-implied price is a decision aid, never a guarantee.
Implied dividend yield and capital gain yield
Two cross-checks help. The implied dividend yield is the next year's dividend divided by the model price: $1.59 ÷ $37.12 is about 4.3%. After the explicit stage, the capital gain yield equals the steady growth rate of 4.5%, so the two yields together reproduce the 9.5% required return of the steady phase only when the price grows with dividends.
Valuing a Four-Year Supernormal Growth Payout Ramp
Marisol Quintero is weighing a regional water-treatment company that trades at $19.85 and just paid an annual dividend of $0.86 per share. Management has guided to payout increases of 21%, 14%, 9% and 7% over the next four years, and she believes growth then fades to 3.8%. Her hurdle is the 10-year Treasury yield of 4.3% plus a 6.5% equity risk premium, so she sets the required return at 10.8%.
She enters $0.86 as the current dividend, adds one growth row per year, puts 3.8% on a final steady row and clicks the calculate button. The multi-stage dividend discount model grows the payout to $1.04, $1.19, $1.29 and $1.38, and discounts those four dividends to $3.77. The year five dividend is $1.44, which gives a terminal value of $20.52 and a present value of $13.61. The price comes back at $17.39.
Against the $19.85 quote, the shares trade 14.1% above her estimate, so at 10.8% they screen as overvalued rather than a bargain. Instead of walking away, she reruns the same rows with the required return lowered to 10.0%, the rate she would accept for a utility-like cash flow. The model now returns $19.66, within 1% of the market price, which tells her the stock is fairly priced only if she is willing to settle for a 10.0% return.
Her decision follows from that single comparison: she places a limit order at $17.40, the 10.8% value, and sets a reminder to refresh the growth rows after the next earnings release.
Sensitivity Analysis of the Valuation
A sensitivity analysis shows how fragile the answer is. Running the same inputs through the calculator again while moving the required return and the steady growth rate by a full point produces the table below.
Required return
3.5% steady growth
4.5% steady growth
5.5% steady growth
8.5%
$37.79
$46.49
$60.97
9.5%
$31.43
$37.12
$45.65
10.5%
$26.89
$30.88
$36.46
One point of extra steady growth lifts the price by about 23% at a 9.5% required return, while one point less cuts it by about 15%. When the gap between r and g narrows, the terminal value grows quickly, so keep the steady rate conservative.
Price sensitivity grid with the $37.12 worked example outlined.
When a Constant Growth Calculator Is Not Enough
A plain constant growth calculator is the right tool for mature companies with long, steady payout histories, such as utilities, consumer staples and many blue-chip names. Running the same example through a single 4.5% rate returns only $28.63, about 23% below the $37.12 multi-stage answer, because it ignores three years of faster payout increases.
The stock calculator approach in this article fits high-growth companies that are expected to mature. It has limits too:
It needs dividend payers; a firm that pays nothing gives the model nothing to discount.
It ignores buybacks, which can return cash without raising the dividend.
It struggles with cyclical businesses whose earnings swing from year to year.
It depends on assumptions that can be tested with the retention ratio and return on equity: sustainable growth is roughly return on equity times the share of earnings retained.
Use the result as one input to your portfolio decisions, alongside other finance metrics and qualitative research, and treat it as an estimate, not a forecast.
Stock Non-constant Growth Calculator questions
What is a non-constant growth stock?
It is a stock whose dividends grow at different rates for a number of years, often called supernormal growth, before settling into a constant rate that lasts indefinitely.
How does the calculator know which growth rate is the steady one?
The last growth rate you enter is treated as the constant rate that applies from that year onward. Rows after it are left blank, and every row before it is a year of explicit growth.
What formula does the calculator use?
It discounts each explicit dividend at your required return, then values the dividends that follow with the Gordon growth formula, next dividend divided by (required return minus steady growth), and discounts that closing value back to today. The two parts are added together.
Why must the required return be higher than the steady growth rate?
If steady growth equals or exceeds the required return, the Gordon growth step gives an infinite or negative value that has no meaning, so the calculator asks you to adjust the inputs.
How is this different from a constant growth stock calculator?
A constant growth calculator assumes one growth rate from the very first dividend. This one lets the early years differ, which matters for companies whose payouts are still ramping up or slowing down.
How do I choose the required return?
Many investors start with a risk-free yield such as a Treasury rate and add a premium for equity risk, then raise it for riskier or less predictable companies.
Can I use it for a stock that pays no dividend?
No. The model values dividends, so a company that pays nothing gives it nothing to discount. Other valuation methods suit those stocks better.