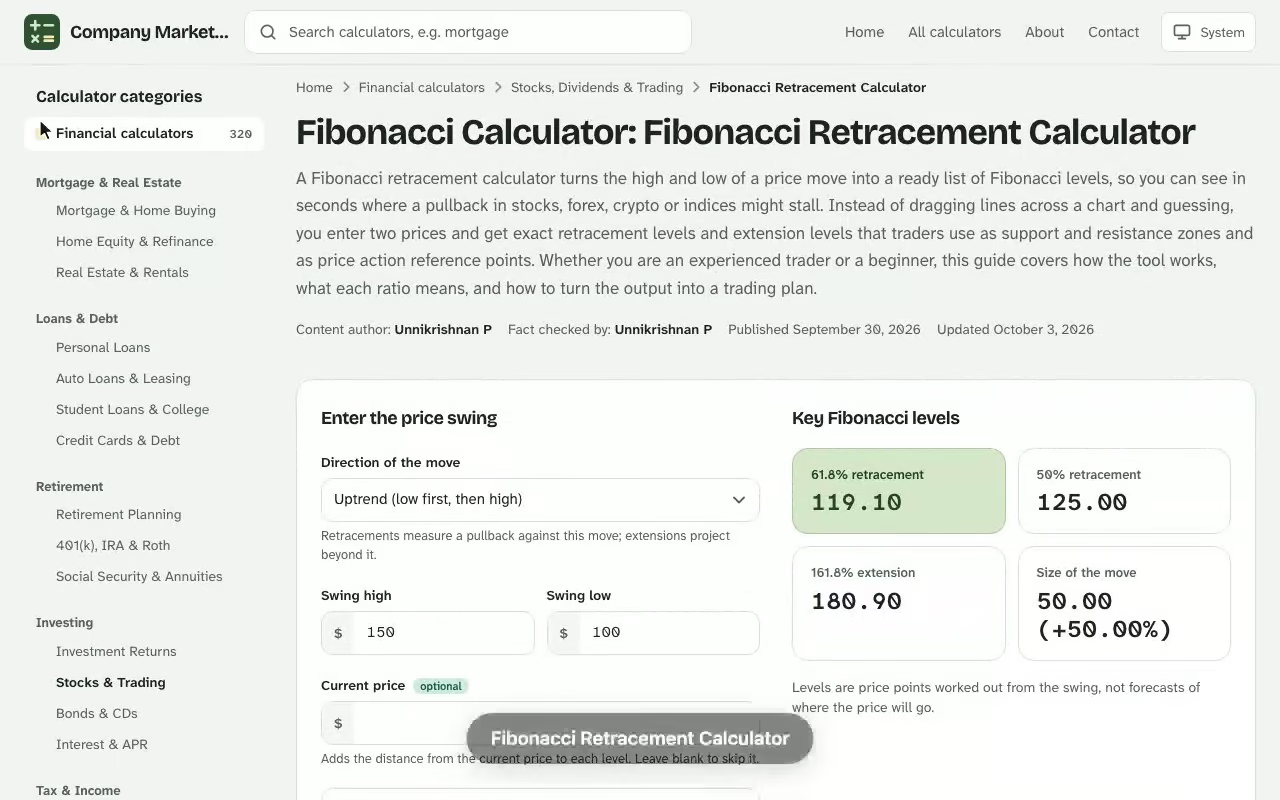
Fibonacci Retracement Calculator. A Fibonacci retracement calculator turns the high and low of a price move into a ready list of Fibonacci levels, so you can see in seconds where a pullback in stocks, forex, crypto or indices might stall. Instead of dragging lines across a chart and guessing, you enter two prices and get exact retracement levels and extension levels that traders use as support and resistance zones and as price action reference points. Whether you are an experienced trader or a beginner, this guide covers how the tool works, what each ratio means, and how to turn the output into a trading plan. Next, open the pivot point calculator online and enter your own details to see an estimate in seconds.
Key Fibonacci levels
61.8% retracement
–
50% retracement
–
161.8% extension
–
Size of the move
–
Levels are price points worked out from the swing, not forecasts of where the price will go.
Retracement levels
Where a pullback against the move would reach each ratio. 0% is the end of the move and 100% is its start.
Level
Price
From current price
Extension levels
Projections beyond the end of the move, measured from its start as a share of the swing: 161.8% is 1.618 times the swing from the starting price.
Level
Price
From current price
Results are estimates for educational purposes and are not financial, tax or legal advice.
How the Fibonacci Retracement Calculator Works
The calculator measures one completed price swing and then projects a fixed set of percentages across it. Every result is a function of three things: the swing high, the swing low and the trend direction. Because the maths is mechanical, the same inputs always return the same levels, which is exactly why so many market participants watch them. A level that is easy to compute is a level thousands of other traders are computing as well, and that shared attention is what makes a Fibonacci calculator useful in the first place. Next, open the stock valuation confidence interval calculator online and enter your own details to see an estimate in seconds.
Entering the swing high and swing low
Start with a clean price swing on your chart. The swing high is the most recent significant peak and the swing low is the most recent significant trough. Type both prices into the tool. The gap between the high and low sets the scale for every level, so pick turning points that stand out on the timeframe you actually trade. A minor wiggle inside a single candle is not a swing.
Choosing the trend direction
The trend direction tells the calculator which way to measure. In an uptrend, levels run down from the high because you are watching for a pullback. In a downtrend, they run up from the low because you are watching for a bounce. Choosing the wrong direction flips every level, so confirm the trend before you calculate.
Reading the retracement and extension results
The output lists each ratio beside its price. Retracement levels sit inside the original swing and show where a correction may pause. Extension levels sit beyond it and show where the next leg may travel. Many versions of this Fibonacci tool also accept custom levels if your strategy relies on a ratio outside the standard set.
Retracement levels mark possible support in an uptrend and possible resistance in a downtrend.
Extension levels mark a possible price target beyond the previous high or low.
The price difference shows the size of the swing the percentages were applied to.
How to Use a Fibonacci Calculator Step by Step
Using an online Fibonacci calculator takes under a minute once you know which swing to measure. Follow these steps for any market, from forex pairs to equity indices. Pair this with the stock constant growth calculator online for a fuller picture before you make a decision.
Choose the market so the calculator applies the right decimal precision for the instrument.
Enter the swing high and the swing low from your chart.
Select uptrend or downtrend to set the trend direction.
Press the calculate button to see every retracement and extension price at once.
Copy the levels you care about onto your chart as horizontal lines and note the time and date of the swing.
Accuracy depends on your inputs: a calculator can only measure the swing you give it, so spend your effort on picking the high and low carefully. Working out a trading setup by hand takes several minutes per chart, while the tool returns all levels in seconds, which is a real saving when you scan many charts in a session.
Fibonacci Retracement Levels and What Each Percentage Means
Every standard ratio describes how deep a pullback is relative to the move before it. Shallow readings suggest strong momentum; deeper readings suggest the trend is under pressure. Most Fibonacci retracement levels come from the Fibonacci sequence, apart from 50% and 100%, which traders include because price so often reacts there.
23.6% is a shallow pullback. A bounce here signals powerful momentum.
38.2% is a moderate pullback and a common zone for trade entries in a healthy trend.
50% is the midpoint. It is not a true Fibonacci number, but institutional traders watch it closely.
61.8% is the golden ratio level, widely treated as the most important of the Fibonacci levels.
76.4% and 78.6% are deep retracement readings, often the last stand before a full reversal.
100% means the whole move has been erased and the earlier trend may be over.
Why 61.8% and 38.2% get the most attention
The 61.8% and 38.2% levels bracket the zone where most orderly corrections end. If price holds above 61.8% in an uptrend, the move is usually still intact. If it closes through that level, the odds of a reversal rise, and traders then look at 78.6%. A reaction at 38.2% instead hints at a strong market that only needed a brief rest.
See how the Fibonacci Retracement Calculator works: change the inputs and the 61.8% retracement updates instantly. Enter your own numbers in the calculator above.The deeper the Fibonacci level, the more of the 44.75 rally is handed back.
The 50% level and the 100% level
Because 50% is a halfway retrace, it works as a natural decision point between a normal pullback and a deeper market correction. The 100% level marks the start of the swing; losing it usually invalidates the setup, which makes it a sensible reference for a stop-loss.
Fibonacci Retracement Formula With a Worked Example
You can verify any output by hand with the Fibonacci formula. Let \(H\) be the swing high and \(L\) the swing low. In an uptrend, each retracement level is the high minus a percentage of the range.
$$\text{Uptrend retracement} = H - (H - L) \times \text{ratio}$$
In a downtrend the same idea runs the other way:
$$\text{Downtrend retracement} = L + (H - L) \times \text{ratio}$$
Extension levels project past the swing, so in an uptrend they use \(H + (H - L) \times \text{ratio}\). Here is a stock that climbed from a swing low of 142.60 to a swing high of 187.35, a swing of 44.75:
Ratio
Type
Calculation
Price
23.6%
Retracement
187.35 − 44.75 × 0.236
176.79
38.2%
Retracement
187.35 − 44.75 × 0.382
170.26
50%
Retracement
187.35 − 44.75 × 0.5
164.97
61.8%
Retracement
187.35 − 44.75 × 0.618
159.69
78.6%
Retracement
187.35 − 44.75 × 0.786
152.18
127.2%
Extension
187.35 + 44.75 × 1.272
244.27
161.8%
Extension
187.35 + 44.75 × 1.618
259.76
261.8%
Extension
187.35 + 44.75 × 2.618
304.51
Uptrend retracement example
If this stock pulls back after reaching 187.35, the first level to watch is 176.79, where only 23.6% of the rise has been given back. A trader who prefers a deeper entry waits for 170.26 or 164.97, and one who wants proof of strength watches how price behaves near 159.69. Falling below 152.18 would mean a deep retracement and a weaker trend.
Fibonacci retracement prices for the 142.60 to 187.35 rally, placed along a price axis.
Downtrend retracement example
Take a currency pair that fell from 1.1086 to 1.0742, a swing of 0.0344. In a downtrend the levels are measured up from the low: 38.2% sits at 1.0873, 50% at 1.0914 and 61.8% at 1.0955. A forex rally that stalls near those prices is a classic place to look for a short entry, since the bear trend may simply be resting.
Fibonacci Extension Levels for Profit Targets
Once price breaks past the old high or low, retracement levels no longer apply, because there is nothing left to retrace. This is where Fibonacci extension levels take over. Fibonacci extensions project the swing forward, giving traders a profit target when the market trend resumes and price makes a new high or new low. The most used ratios are 127.2%, 161.8% and 261.8%; some tools also show 138.2% and 200%.
In the example above, a breakout over 187.35 points toward 244.27 first, then 259.76. Many traders scale out of a position at each extension, locking in gains while a smaller portion keeps running. A fib extension is a guide to where supply may appear, not a promise that price will arrive.
Difference between retracement and extension
Retracement measures how far price pulls back inside an existing move, so it helps with entry points. Extension measures where price may go beyond that move, so it helps with exits. A complete plan uses the Fibonacci retracement and extension together: one set of levels to get in, the other to get out. Whichever Fibonacci trading calculator or Fibonacci calculator you use, check that it shows both sets side by side.
Planning a Pullback Entry With a Fibonacci Calculator
A swing trader is watching an index fund that ran from 62.18 to 71.94 over eleven sessions and has now started to slip. She wants to buy the dip but refuses to guess where it ends, so she opens the calculator, selects uptrend, and enters 62.18 as the low and 71.94 as the high. The price difference comes back as 9.76, and the Fibonacci retracement output fills in below it.
Level
Price
38.2%
68.21
50%
67.06
61.8%
65.91
78.6%
64.27
She checks her chart: the fund already tagged 68.21 and bounced weakly, which tells her the buyers are not in a hurry. So she places a limit order at 67.06, the 50% retracement, rather than chasing the first level. Her stop goes at 65.40, a few cents under the 61.8% golden ratio price of 65.91, because a close below that line would break the textbook pullback structure. The risk is 1.66 a share (67.06 minus 65.40).
For the exit she reruns the numbers with the extension option. The first extension target comes to 84.36, which is far beyond her horizon, so she takes the prior high of 71.94 instead: a reward of 4.88 a share. Dividing 4.88 by 1.66 gives a reward-to-risk ratio of 2.94, above her personal 2.5 minimum, so the trade is worth placing. Had it come out at 1.8, her next step would have been to rerun the calculation using the 61.8% level as the entry, or skip the trade altogether.
Using a Free Fibonacci Calculator in a Trading Strategy
A free Fibonacci calculator is most useful as part of a wider trading strategy rather than as a stand-alone signal. The levels tell you where to pay attention; other evidence tells you whether to act. Traders who treat the output as a map rather than a prediction tend to make better decisions, and confidence in a trading plan comes from rules written down before the trade.
Planning trade entries
Look for price to pull into the zone between 38.2% and 61.8%, then wait for confirmation such as a bullish candlestick pattern, rising volume or a trend indicator turning. The same logic works in reverse for a bearish setup. Entering on confirmation, rather than on the bare touch of a level, filters out many failed trades.
Setting stop-loss and take-profit orders
A stop loss placed just beyond the next Fibonacci level keeps risk defined: if the 61.8% level fails, 78.6% is the sensible exit. The take-profit goes at an extension or at the prior high. Together these orders turn a loose idea into measured risk management with a known reward-to-risk ratio.
Forex, stocks, crypto, indices and futures
The same Fibonacci levels apply to forex pairs, stocks, crypto, indices, futures and other financial instruments, because the ratios work on percentages of the move rather than on any one asset. Precision differs: a forex pair needs four or five decimals, a stock two, and a crypto coin can need more. The approach also works on any timeframe, from one-minute scalps to weekly swing trades, though levels drawn on longer timeframes usually carry more weight. For any investment decision, check the same levels on two timeframes before you commit.
Fibonacci Retracement Levels for Beginners: A Practical Walkthrough
If you are one of the many beginners learning technical analysis, start by treating Fibonacci levels as a checklist for decision-making rather than a forecast. A good Fibonacci extension calculator or retracement tool removes the arithmetic, but the judgment about where a swing begins and ends stays with you. Three habits make the biggest difference to your trading results, whichever calculator you pick, and each one applies to every set of Fibonacci levels you plot.
Mark support level and resistance level zones, not single lines
Price rarely turns on one exact tick. Treat each support level or resistance level from the calculator as a band a few percent of the swing wide, and look for the place where several Fibonacci retracement levels from different swings overlap. Overlap is the heart of support and resistance analysis: one level is a hint, three levels in the same band are a zone worth planning around.
Read candlestick patterns at the calculator's levels
A level only matters when price reacts to it. Once the calculator returns the middle prices, watch the candlestick patterns that form there, such as a hammer or an engulfing candle. A long wick that rejects one of those prices in a bull market is stronger evidence than a candle that simply closes beside it. Note which candle triggered each entry so you can review how each fib retracement setup performed.
Pick the swing high and swing low from the larger picture first
The calculator is only as good as the swing you feed it, so give every setup enough time to develop. Start from the weekly or daily chart to choose the swing high and swing low, then drop to a shorter chart for the trade itself. Beginners often enter a three-candle swing and wonder why the levels fail; a swing large enough to matter on the daily chart gives the output real weight and protects your capital, which is the financial security a trading plan exists to provide. Keep position sizes small while you learn how the market treats each level, since the Fibonacci numbers behind the ratios are the origin of the method, not a guarantee.
Fibonacci Sequence and the Golden Ratio Behind the Fibonacci Ratios
The Fibonacci numbers form a sequence in which each number is the sum of the two before it: 0, 1, 1, 2, 3, 5, 8, 13, 21, 34, 55, 89. Divide any number by the next one up and the answer settles near 0.618, the golden ratio; divide it by the number two places up and you land near 0.382; three places up gives about 0.236. The inverse, 1.618, produces the main extension. The ratio appears in nature, from flower petals to the spiral of a shell, which is part of why the idea was borrowed for markets.
Why the Fibonacci indicator may work
Nobody has proven that markets obey these ratios. A common explanation is that the levels are self-fulfilling: enough traders place orders at the same prices that the reaction becomes real, with supply and demand meeting at the same price. Others note that pullbacks of roughly one third to two thirds are simply normal in any trend, and that impulse moves in Elliott Waves often retrace by these amounts.
Limitations of Fibonacci Retracement Analysis
No single technical analysis tool is reliable alone, and Fibonacci levels are no exception. Keep the following in mind.
Different traders choose different swing points, so levels are subjective.
Price can slice through a level without any reaction, especially around news, and the move may only be temporary.
Many levels cluster in a small area, so some line is nearly always close to price.
Results are best combined with pivot points, moving averages or wave counts, and tracked in a trading journal so you learn which setups actually pay.
Treat the output as a map of probable reaction zones. Combine it with sound position sizing, and never risk more than you can afford to lose; this page is educational and not financial advice.
Fibonacci Retracement Calculator questions
What is a Fibonacci retracement?
A Fibonacci retracement is a technical analysis tool that applies ratios such as 23.6%, 38.2%, 50%, 61.8% and 78.6% to the distance between a swing high and a swing low. The resulting prices are watched as possible support or resistance where a pullback may pause before the trend continues.
How do you calculate Fibonacci retracement levels?
In an uptrend, subtract the price difference multiplied by each ratio from the swing high. In a downtrend, add the price difference multiplied by each ratio to the swing low. The calculator does this for every ratio at once.
What is the difference between Fibonacci retracement and extension levels?
Retracement levels fall inside the original move and help you look for pullback entries. Extension levels project beyond the swing high or low and are commonly used to set profit targets once price breaks past the old extreme.
Which Fibonacci levels matter most?
Most traders focus on 38.2%, 50% and 61.8%. The 61.8% level, linked to the golden ratio, is usually considered the most significant, while 50% is not a true Fibonacci ratio but is widely watched.
Do I use the high or the low as the starting point?
Pick the trend direction first. In an uptrend the levels are measured down from the high, and in a downtrend they are measured up from the low. Choosing the wrong direction flips every level.
What is the custom price field for?
The optional custom price lets extension levels project from a point other than the swing high or low, such as the end of a pullback, while still using the size of the original swing.
Does the Fibonacci calculator work for stocks, forex and crypto?
Yes. The ratios are percentages of the move, so they apply to any market and timeframe. Choose the market precision so the prices show the right number of decimals for the instrument.
Are Fibonacci levels guaranteed to hold?
No. Fibonacci levels are zones where price has often reacted, not predictions, so combine them with other evidence such as candlestick patterns, volume and a defined stop-loss.