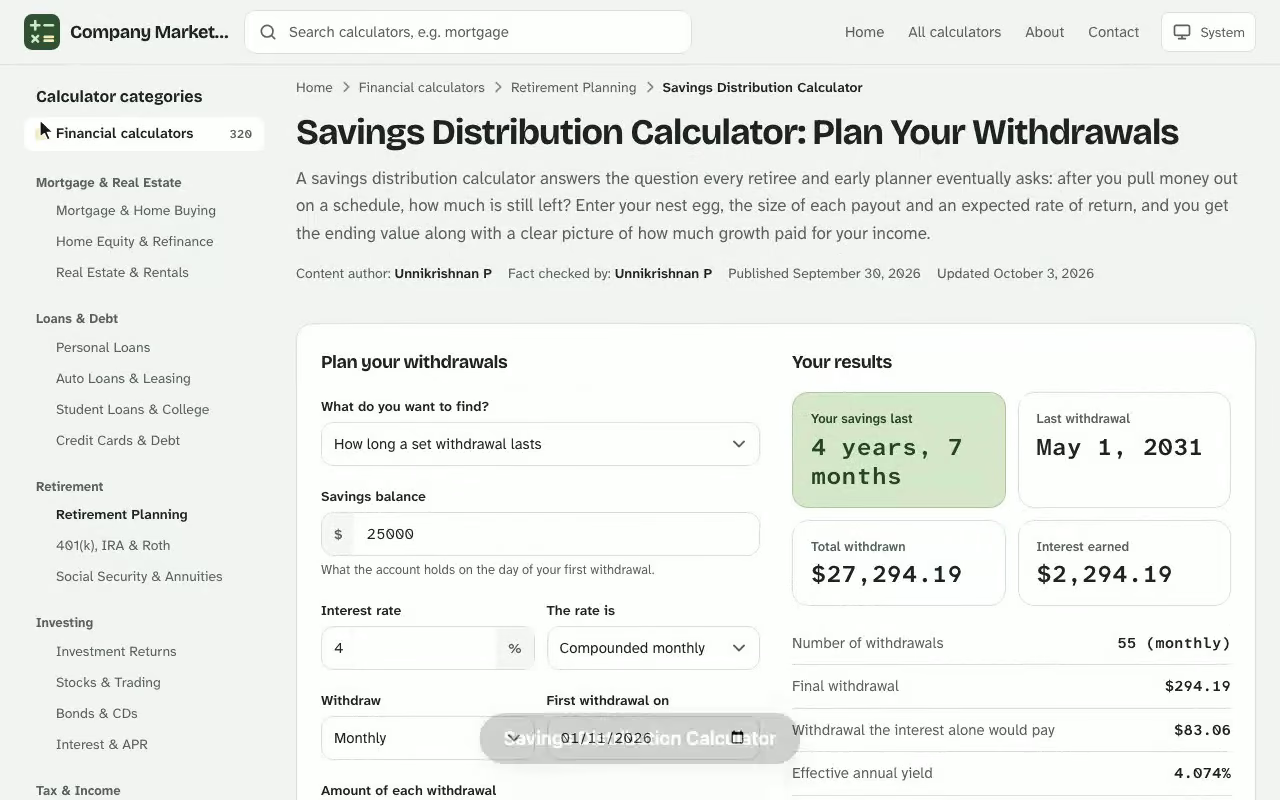
Savings Distribution Calculator. A savings distribution calculator answers the question every retiree and early planner eventually asks: after you pull money out on a schedule, how much is still left? Enter your nest egg, the size of each payout and an expected rate of return, and you get the ending value along with a clear picture of how much growth paid for your income. If you want to see how the figures change, the free life expectancy calculator gives you an instant result you can adjust as you go.
Your results
Your savings last
–
Last withdrawal
–
Total withdrawn
–
Interest earned
–
Number of withdrawals–
Final withdrawal–
Withdrawal the interest alone would pay–
Effective annual yield–
Year-by-year drawdown
Each year starts on an anniversary of your first withdrawal. Interest is added after each withdrawal on what is left in the account.
Year
Starts
Withdrawn
Interest
Ending balance
Results are estimates for educational purposes and are not financial, tax or legal advice.
Savings Distribution Calculator Inputs and What They Mean
Six inputs drive the whole result, and each one changes the outcome in a different way. The tool assumes every payout lands at the beginning of each period, so the cash leaves before it earns anything. That timing is slightly more cautious than taking cash at the end of the month. Try the free two-spouse retirement planner to run your own numbers — everything is calculated in your browser and nothing you enter is stored or sent anywhere.
Starting amount
Your starting amount is the lump sum in the account on the day your payouts begin. It may be a rollover, an inheritance or the proceeds of a sale. If your money sits in several places, add the starting balance of every account together before you enter it.
Years of withdrawals
Enter the number of years of withdrawals you want to plan for. A fourteen-year span, for example, bridges the gap between leaving full-time work at 55 and the day a pension starts at 69. Shorter spans suit a tuition fund or a one-off project, while a longer span tests how durable your retirement investment plan really is.
Periodic withdrawal
The periodic withdrawal is the dollar figure you take out each time. Use your real target income rather than a round guess, because small differences compound across hundreds of payouts. Treat it as a gross figure: taxes and account charges come out of what you receive, not out of what the tool subtracts.
Rate of return
The rate of return is the yearly growth, or earnings, you expect from your investment mix. A compounded rate of return includes growth on earlier growth, which is how long-term index funds are normally quoted, while a bank quotes a plainer annual rate of return. Pick a figure you could defend for this investment in a downturn, not the best year you remember.
Frequency of withdrawals
Choose how often cash leaves the account: weekly, bi-weekly, monthly, quarterly or annually. More frequent draws leave a little more working money in place between payouts, so the final figure creeps up as the schedule tightens. A separate setting lets you choose how often interest income is credited, which matters most for bank products.
How Distributing Savings Over Time Works
Behind the screen sits a simple repeating rule. Each period, one payout leaves, then the remainder grows by that period's rate. Repeating the rule for every period gives a closed formula you can check by hand: The retirement plan withdrawal calculator online uses the same plain-English approach, so you can compare results side by side.
Here \(B_0\) is your starting amount, \(W\) is the payout, \(n\) is the number of payouts and \(i\) is the growth rate for one period. When interest is credited \(m\) times a year but you draw \(p\) times a year, the per-period rate is converted first:
$$i = \left(1+\frac{r}{m}\right)^{m/p} - 1$$
How compound interest shapes the result
The first term of the formula is your pot growing on its own, and the second is the stream of payouts, each one losing the growth it would have earned. Compound interest works in both directions: every dollar you leave in place keeps producing accumulated interest, but every dollar you remove stops doing so. The larger your remaining principal, the more of each payout your investment growth covers.
Worked Example: Distributing a $412,500 Nest Egg Over 14 Years
Suppose you start with $412,500 of investment savings, take $2,350 every month for 14 years, and expect 5.35% a year, credited monthly. The monthly growth rate is \(0.0535 \div 12 = 0.004458\), and there are \(14 \times 12 = 168\) payouts. Running the formula gives an ending value of $282,523.
The year-end snapshots below show how slowly the pot drains at first. In the early years growth nearly matches what you take out, and the slope steepens only as the remaining base shrinks.
Year
Total paid out so far
Value at year end
2
$56,400
$399,323
4
$112,800
$384,661
6
$169,200
$368,348
8
$225,600
$350,196
10
$282,000
$329,999
12
$338,400
$307,527
14
$394,800
$282,523
Over the 14th year you will have taken out $394,800 in total, and growth supplied $264,823 of it. The nest egg lost only $129,977 even though you spent almost as much as you started with.
How growth and payouts combine to leave $282,523 from the worked example.
Enter 412,500 as the starting amount.
Enter 14 for the number of years and 2,350 for the payout.
Set the payout schedule to monthly and the growth rate to 5.35%.
Set interest to be credited monthly, then click the calculate button.
Reading Withdrawal Results: How Rate and Payout Size Change the Outcome
A single answer is only a starting point, so test the neighbouring cases. Holding everything else from the example fixed, moving the growth rate by one percentage point at a time shows how much the outcome depends on a number nobody can promise.
Annual rate
Ending value after 14 years
3.35%
$154,659
4.35%
$213,291
5.35%
$282,523
6.35%
$364,061
7.35%
$459,880
Payout size matters just as much. At $2,000 a month the same pot ends at $370,159, at $2,700 it ends at $194,886, and at $3,000 only $119,769 remains. Push the draw to $3,400 and only $19,613 remains after 14 years. The funds are gone after 174 payouts, roughly 14 years and 6 months, so the plan barely outlasts your target.
Ending value after 14 years for five growth rates and four payout sizes.
Schedule matters too, though less. Taking the same $28,200 a year in four quarterly instalments ends at $279,903, while a single yearly draw ends at $268,020, which is $14,503 below the monthly result. Frequent, smaller draws keep more money working.
Distributing a $236,840 Rollover to Bridge the Years Before Social Security
A 59-year-old machinist has just rolled $236,840 out of an employer plan and wants it to cover living costs until age 70, when delayed Social Security credits stop growing and the larger check begins. That is 11 years, or 132 monthly payouts, and the household needs $1,415 a month from the rollover to fill the gap.
The rollover is invested in a balanced fund, and the fund's own fact sheet shows a blended long-run return near 4.15% after fees. So the entries are 236,840 as the starting amount, 11 years, $1,415 monthly, 4.15% and monthly crediting. After one click on the calculate button, the ending-value figure for this distribution plan reads $136,545, with $186,780 paid out in total.
See how the Savings Distribution Calculator works: change the inputs and the you can withdraw updates instantly. Enter your own numbers in the calculator above.
Next comes the check that matters. The couple has set a personal floor of $120,000 at age 70, roughly one year of expenses plus a repair reserve. $136,545 clears it by $16,545, which feels comfortable until the rate field is dropped to 3.15% to mimic a weak decade. The result slides to $111,302, which is $8,698 below the floor.
Scenario
Payout
Rate
Value at 70
Base case
$1,415
4.15%
$136,545
Weak decade
$1,415
3.15%
$111,302
Trimmed payout
$1,250
3.15%
$137,359
Rather than hope for the base case, the machinist reruns the weak-decade rate with the payout lowered to $1,250. The pot now ends at $137,359, above the floor even in the weak scenario, so $1,250 becomes the figure written into the household budget, with the extra $165 a month coming from part-time shifts.
Risk, Fees and Volatility Behind Long-Term Withdrawals
A calculator multiplies a steady rate across every year, but real markets do not move that way. Volatility matters most early: a sharp drop in the first few years, combined with ongoing payouts, can force you to sell more units at low prices, and the pot may never recover. That is the practical meaning of loss of principal for a retiree.
Your investment choices change the risk. Investments such as a stock fund or a mutual fund can swing widely, while savings accounts and CDs at a financial institution pay less but protect your balance. Funds also charge fees, and those reduce the return you actually keep, so enter a rate after costs, and match the rate field to the mix you actually hold. Quoted index history, such as the S&P 500 with its reinvestment of dividends, is a record of the past, and every projection here is hypothetical.
Treat the output as one scenario among several. Spreading investments across asset types softens the damage from any one bad year. Run a cautious case, a middle case and an optimistic case, then plan around the cautious one.
When a Savings Goal Calculator Fits Better
This tool starts with a pile of money and spends it down. A savings goal calculator starts from the opposite end: you name the target, and it tells you what to contribute each month to reach it. Use that one while you are still building the pot, and come back here once the target is reached and income is the question.
Many planners pair the two. The first estimates the monthly saving needed to reach a target by a given age, and the second checks that the target actually supports the lifestyle you want. Either way, the figures are a guide for financial planning, not a promise, so review them when your income, spending or markets change.
Savings Distribution Calculator questions
What does a savings distribution calculator tell you?
It shows how much of your savings remains after a series of regular withdrawals. You enter a starting amount, how much you withdraw and how often, the years of withdrawals and an expected rate of return, and it returns your expected ending balance.
When does each withdrawal happen in the calculation?
The calculator assumes you take each withdrawal at the beginning of its period, so that money stops earning returns straight away. This is slightly more cautious than withdrawing at the end of the period.
What rate of return should you enter?
Use a rate you could defend in a weak market, after fees. Stock and mutual fund returns vary widely and can include a loss of principal, while savings accounts and CDs pay less but carry much lower risk. Any figure you enter is a hypothetical assumption, not a promise.
How does the compounding frequency change the result?
The more often interest is added to your account, the sooner earned interest starts earning interest of its own. For stock and mutual fund investments, choose annually; for savings accounts and CDs, check with your financial institution how often interest is compounded.
Does withdrawing more often change the ending balance?
Slightly. With the same total spent each year, smaller and more frequent withdrawals leave more money invested between payouts, so the ending balance is a little higher than with a single annual withdrawal.
What happens if your withdrawals are too large?
The account balance reaches zero before the end of your chosen years. The calculator then reports the ending balance as zero and tells you roughly how long your funds last, so you can lower the withdrawal or shorten the period.
How is this different from a savings goal calculator?
A savings goal calculator works toward a target: it tells you how much to contribute each month to reach it. A savings distribution calculator starts with money you already have and shows what is left as you spend it down.
Does the result include taxes or inflation?
No. The result is a pre-tax, nominal figure. Taxes on withdrawals and rising living costs will reduce what your money can buy, so treat the result as a starting point for planning.