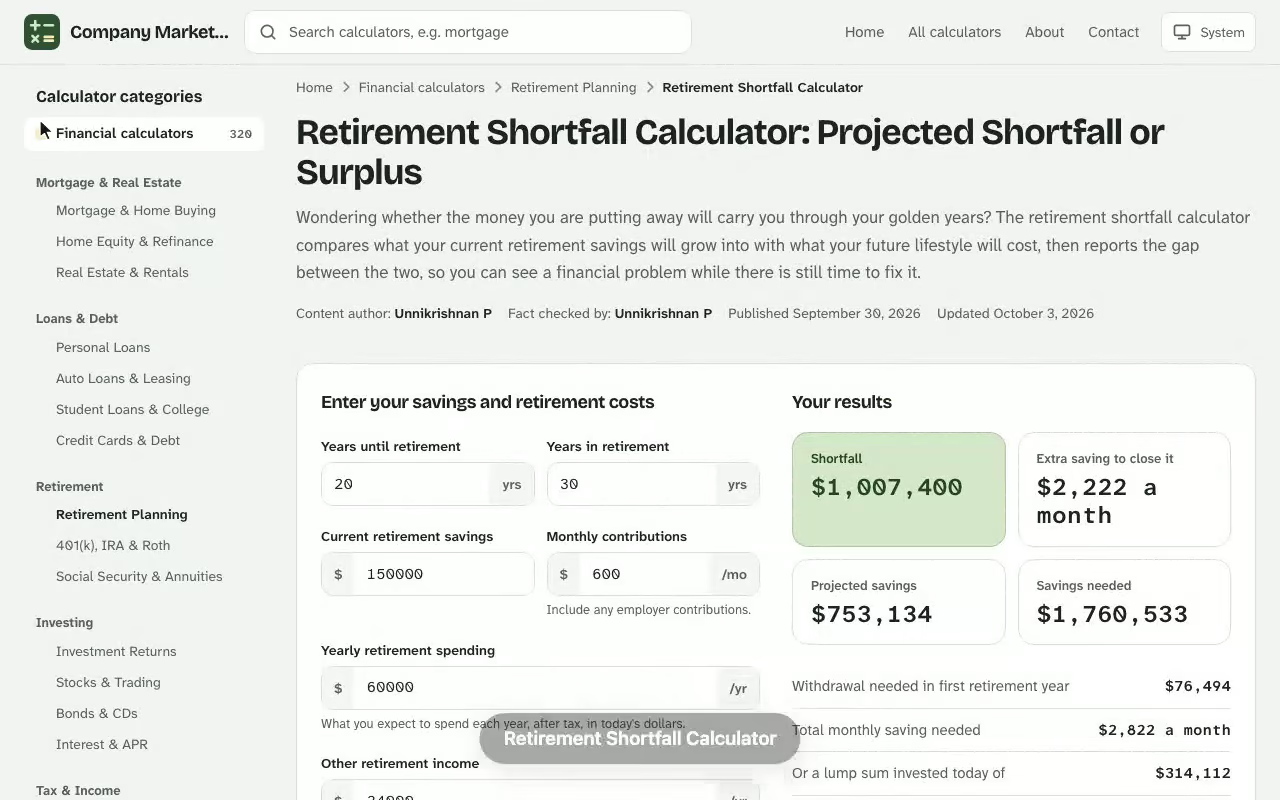
Retirement Shortfall Calculator. Wondering whether the money you are putting away will carry you through your golden years? The retirement shortfall calculator compares what your current retirement savings will grow into with what your future lifestyle will cost, then reports the gap between the two, so you can see a financial problem while there is still time to fix it. Try the life expectancy calculator online to run your own numbers — everything is calculated in your browser and nothing you enter is stored or sent anywhere.
Your results
Shortfall
–
Extra saving to close it
–
Projected savings
–
Savings needed
–
Withdrawal needed in first retirement year–
Total monthly saving needed–
Or a lump sum invested today of–
Projected savings would last–
Savings path to retirement
Your balance at the end of each year on your current plan, and with the extra monthly saving that closes the gap.
Year
Current plan
With extra saving
Results are estimates for educational purposes and are not financial, tax or legal advice.
What a Retirement Shortfall Means for Your Nest Egg
A retirement shortfall is the amount by which your projected savings fall short of the money you will need to pay for retirement expenses. If the balance you build is larger than the amount required, the result flips into a surplus. Either way, the number turns a vague worry about running out of money into a figure you can act on. Try the retirement savings analysis online to run your own numbers — everything is calculated in your browser and nothing you enter is stored or sent anywhere.
The result matters because the two sides of the equation move independently. Your retirement nest egg and other financial resources depend on how much you save and what it earns. Your spending depends on inflation, taxes and how many years you live. A plan that looks comfortable in today's dollars can still come up short once prices rise for a couple of decades, and that is why a quick mental estimate of "I have enough" so often fails. Running out of savings is rarely a dramatic event. It is a slow drain that starts a few years before the money is gone.
Shortfall, surplus and how long savings last
The calculator reports three related answers: the shortfall or surplus measured in today's dollars at the date you stop working, the projected balance on that date, and the number of years your money will last in retirement. The third answer is the easiest to feel. Being told you are short by a large sum is abstract; being told the money lasts 17 years of a 26-year retirement is not.
The Shortfall Calculator Formula in Three Steps
Every shortfall calculator of this type follows the same logic: grow the balance, price the spending, compare. Your inputs flow through three steps, and each can be checked by hand or in a spreadsheet. If you want to see how the figures change, the retirement nest egg calculator online gives you an instant result you can adjust as you go.
Step 1: Project your balance at retirement
During the saving years, your balance compounds each month and each contribution is added at the beginning of the month. The growth rate is your return after income taxes on earnings, divided by 12:
Here \(C\) is the monthly contribution, \(r_{b}\) is the pre-retirement rate of return and \(t\) is your combined federal and state tax rate. Repeat for every month until the retirement date to get the projected savings balance.
Step 2: Price the retirement income you need
Your annual spending is entered in today's dollars. When the inflation adjustment is on, it grows each year at the inflation rate, first through the years you still have to work and then through each year of retirement:
$$E_{k} = E_{0}\times(1+i)^{\,Y+k}$$
Discount each year's spending back to the retirement date at the after-tax return you expect during retirement, and add the results. That total is the lump sum you need on day one.
Step 3: Compare the two
The final step is a subtraction. Shortfall = money needed − projected balance. A positive answer is a gap to close; a negative answer is your surplus. The same schedule also tells you the year in which the balance reaches zero, which becomes the number of years your savings last.
Retirement Shortfall Calculator Definitions: Every Input Explained
The retirement shortfall calculator asks for ten values. Entering them carefully matters more than the maths, because each one is multiplied by decades of compounding.
See how the Retirement Shortfall Calculator works: change the inputs and the surplus updates instantly. Enter your own numbers in the calculator above.
Current retirement savings
Enter everything set aside specifically for your later years, including 401(k) and 403(b) balances, IRAs and any retirement accounts held outside an employer plan. Leave out money earmarked for something else, such as a child's tuition or a house deposit.
Monthly contributions
This is the total you save each month across your 401(k), 403(b), IRA and Roth IRA accounts, and it should include your employer's contributions as well as your own. Add them up as cumulative savings per month, not per paycheck. The tool assumes the amount stays level until you retire and is paid at the start of each month.
Years before you retire
The number of years of saving left. Enter zero if you plan to stop working immediately. Each extra year adds a contribution year and removes a drawdown year, so this input is among the most powerful.
Number of years in retirement
The length of time your savings must cover. Plan for a long lifespan, and if the plan supports a spouse as well, use the years of whoever is likely to live longer.
Annual retirement expenses
Your yearly spending, entered after tax and in today's dollars. Because the model taxes your earnings as they are credited, your retirement expenses belong on an after-tax basis.
Expected inflation rate
The average annual rise in prices you assume. The Consumer Price Index (CPI) is the standard measure, and its long-term average since 1925 has been close to 3%. Choosing between 2% and 3% matters far more than it appears over a 40-year span.
Rate of return before retirement
The annually compounded growth you expect before taxes while you are still saving. This is usually higher than the later rate because the portfolio can hold more stocks. The compounded rate of return for broad stock indexes has been strong in some decades and negative in others, and a long-run compounded rate of return hides the bad years, so treat any single figure as an estimate, not a promise.
Rate of return during retirement
The growth you expect once you start withdrawing. It is typically lower, since most people shift toward conservative investments to protect what they have built.
Federal tax rate
Your federal marginal tax rate, found from your tax bracket. It is applied to investment earnings each year.
State tax rate
Your state's rate on the same earnings. Enter zero if your state has no income taxes. The two rates are added together to form a single combined rate in the formulas above.
There is also an inflation adjustment checkbox. Tick it to raise your spending each year; leave it clear only if you expect your costs to stay flat, which is rarely realistic.
Worked Example: A Projected Shortfall of $550,525
Consider a saver with the following inputs. Every figure below is the same one the formulas in this article produce, so you can reproduce it yourself.
Input
Value
Current retirement savings
$268,500
Monthly contributions
$1,475
Years before you retire
19
Number of years in retirement
26
Annual retirement expenses (today's dollars)
$47,200
Expected inflation rate
2.4%
Rate of return before / during retirement
6.5% / 4.2%
Federal / state tax rate
22% / 4%
How the balance builds
After the combined 26% tax, the saving-years return becomes 4.81% and the retirement return becomes 3.108%. Over 19 years, the balance grows from $268,500 to $1,218,725. Of that, $336,300 comes from your own monthly contributions (228 payments of $1,475) and $613,925 comes from growth on the money.
What the retirement years cost
Inflation lifts the $47,200 budget to $74,070 in the first year of retirement. Discounted at 3.108%, the 26 years of rising bills add up to $1,769,250 on the retirement date.
How a $1,218,725 balance builds from savings, contributions and growth.
The result
The balance is $1,218,725 and the need is $1,769,250, so the projected shortfall is $550,525. Spending the balance year by year, the money is exhausted partway through year 18, which means your savings last about 17.4 of the 26 years. The last eight or so years would be unfunded.
Savings in the worked example last 17.4 of 26 years.
Reading Your Projected Shortfall or Surplus
The size of the number matters less than what it implies. Use this checklist to interpret it and plan your next move:
A positive shortfall: your plan runs dry before the end of your expected years. The balance column hits zero in the final-years schedule.
A shortfall of a few percent of the need: small changes, such as a modest contribution increase, can erase it.
A large shortfall: expect to combine several changes, because no single lever may be enough.
A surplus: your plan has a cushion. Check that your assumptions are not too optimistic before relaxing.
Stress-test the assumptions
Change one input at a time and look for the cases where the answer swings widely. A plan that works only at a 7% return and 2% inflation is fragile. Rerun it with a lower return and a higher rate of inflation to see the downside.
Ways to Close a Retirement Planning Gap
If the result is a shortfall, retirement planning offers four main levers. Each is tested below on the worked example, changing only that one input.
Change (one at a time)
Projected shortfall
Years savings last
No change
$550,525
17.4
Save more: $2,100 a month
$317,347
21.0
Delay your retirement by 3 years (22 years to go)
$434,987
19.6
Spend less: $41,000 a year
$318,123
20.2
Earn a better rate of return in retirement: 5.2%
$406,048
18.6
Shortfall before and after changing one input at a time.
Save more
Raising contributions by $625 a month cuts the gap by $233,178. Because the extra deposits start compounding immediately, each additional dollar saved early is worth more than one saved late. Closing the gap with contributions alone would take roughly $2,951 a month.
Delay your retirement
Working three more years adds contributions, gives the balance more time to grow, and shortens the drawdown. It also raises the price of every future bill, so the gain is smaller than many people expect, as the table shows.
Spend less in retirement
Trimming annual spending from $47,200 to $41,000 has almost the same effect as the higher contribution, and it costs nothing during the working years. Your monthly spending in retirement is the one number you can still negotiate with yourself right up to the end.
Aim for a better rate of return, carefully
A better rate of return helps, but chasing it by taking on more risk is the weakest lever. Notice that raising the retirement return by one point matters less than the saving and spending changes. Combined changes work best: $2,100 a month, retiring after 22 years and spending $41,000 turns the same plan into a surplus of $108,099.
Pricing a Retirement Shortfall at Age 55: One School Administrator's Run
A school administrator, 55, wants to stop work at 62, the first age Social Security retirement benefits can be claimed, and has a 403(b) statement open beside the shortfall calculator. The account holds $412,860, payroll deductions plus the district match come to $2,340 a month, and the household budget is $41,300 a year after tax.
The entries follow from those numbers: 7 years before retirement, 24 years in retirement (to age 86), 2.7% inflation, 5.8% before and 4.0% during retirement, and combined federal and state rates of 24% and 5%. Spending stays on the inflation adjustment.
The calculator returns a projected balance of $778,678 at 62. Inflation has turned $41,300 into $49,767 for the first retirement year, so the total needed on the retirement date is $1,175,899. The projected shortfall is $397,221, and the money lasts 15.8 of 24 years, running dry at about age 78.
Age 59½, the point where penalty-free withdrawals open up for a 403(b), is not the issue here, because the plan starts at 62. The real question is the order of the fixes. The administrator reruns the figures three times, changing one input each time:
Contributions raised to $3,100 a month: shortfall $323,120, 17.3 years.
Spending cut to $37,500: shortfall $289,027, 17.4 years.
Retiring at 64 instead of 62: shortfall $336,215, 17.4 years.
Lowering the budget wins, and it needs no extra saving. The decision: trim $3,800 from yearly spending by the spring review and increase the 403(b) deferral at the next open-enrollment window, then rerun the calculation with the new statement figures before the district's retirement-notice deadline.
Retirement Savings and Inflation: Why Purchasing Power Matters
Inflation is the quiet driver behind most shortfalls. In the example above, $47,200 of today's spending needs $74,070 in the first retirement year, because prices have compounded at 2.4% for 19 years. The purchasing power of every dollar in your account falls over time, and a long retirement lets the effect build for another quarter century.
Planning for it matters: if you ignore inflation, you would compare a future balance with a spending figure that no longer buys the same things. That is why the calculator offers an inflation-adjusted mode and why leaving it switched on is the safer choice. A fixed-income plan also faces the risk that your spending is higher in the early active years of retirement, with travel and hobbies, than later on.
The long-term inflation you choose should be a considered average, not last year's headline number. Rates above 3% over decades are possible, so test a higher figure as a stress case.
Retirement Plan Accounts, Taxes and Withdrawals
The type of retirement plan you use decides when taxes are paid. Whether your retirement savings sit in a 401(k), a 403(b) or an IRA, the tax treatment sets how much you keep. Money in a traditional 401(k), 403(b), 457(b) or IRA goes in pre-tax and is taxed as income when you take withdrawals. A Roth IRA or a Roth 401(k) is funded with after-tax dollars, and qualified withdrawals are tax-free.
Compare your 401(k) and IRA balances separately if you can. This model taxes growth every year at your combined rate, which is a conservative simplification. Your actual tax bill will depend on the mix of accounts you hold, so a household with mostly Roth money may do better than the calculator shows, while one with only pre-tax money could face higher taxes on withdrawals than assumed.
When you enter spending, remember the tool wants after-tax amounts. If you think in terms of gross income, convert the figure before you type it in, otherwise the calculator will understate the problem.
Retirement Income From Social Security, Pensions and Other Sources
Your savings may not be the only source of retirement income. Social Security pays a monthly benefit based on your earnings history, and a delayed claim raises the amount. A pension from a former employer adds a fixed monthly payment, and other income such as rent or part-time work can reduce what you must draw from savings.
The simple shortfall model asks only for spending and savings, so a good way to include these sources is to subtract the expected monthly pension and Social Security benefits from your expected budget before entering the annual retirement expenses figure. The remainder is what your portfolio has to fund. Many people are surprised at how much smaller the shortfall becomes when they take this step.
Because the future of Social Security is debated, run the calculation twice: once assuming full benefits and once with a reduced benefit, and plan around the more cautious answer.
Investments and Risk: Choosing a Rate of Return for Your Retirement Savings
The two return inputs are where your investments enter the calculation, so the mix of stocks, bonds and cash behind each rate decides how reliable the projected shortfall is. Historically, the S&P 500 has produced strong long-run gains with reinvestment of dividends, but with years of steep losses along the way, so the average past figure should not be copied straight into the before-retirement field. A diversified portfolio of mutual funds manages volatility, though it cannot guarantee a rate.
Your risk tolerance and timeline explain why the during-retirement rate is lower than the one before it: a heavier weighting in the stock market early on gives way to conservative investments as the retirement age approaches. The trade-off runs both ways. Savings accounts and CDs keep the principal safe but earn little after inflation, so an overly cautious assumption inflates your projected shortfall, while an optimistic one hides it.
Past investment returns do not predict future ones. Enter a realistic rate, then rerun the calculator with a lower one and treat that result as your floor test.
Beyond the Calculator: A Retirement Planner Checklist
A retirement planner would look at several items this tool leaves out. Use the list below as a prompt for your own review, and see a professional or attend a retirement workshop if the answers are unclear.
Healthcare costs: premiums and out-of-pocket bills rise faster than general prices. Consider a health savings account and review Medicare options.
Long-term care: a single stay can wipe out years of progress, so price the cost of cover or self-funding.
Early retirement: leaving before age 59½ may bring penalties on some accounts and a longer period without benefits.
Budget review: track spending each year and adjust to protect your earnings and balance.
Good financial planning treats the calculator as one view of your retirement savings. A retirement calculator and a full retirement planner calculator work best together: the first gives a fast diagnosis of the gap, the second models pensions, two incomes and changing tax rates. Building a lasting wealth plan means revisiting the result every year as your balance, interest rates and goals move.
Retirement Shortfall Calculator questions
What is a retirement shortfall?
A retirement shortfall is the amount by which your projected savings fall short of the money you will need to fund your retirement expenses. If your savings exceed what you need, the result is a surplus instead.
How does the calculator work out the shortfall?
It grows your current savings and monthly contributions to your retirement date at an after-tax rate of return, then adds up your inflation-adjusted yearly expenses discounted at your after-tax retirement return. The difference between the money needed and your projected balance is the shortfall or surplus.
What should I enter as annual retirement expenses?
Enter your yearly spending after taxes and in today's dollars. The calculator taxes investment earnings as they are credited, so expenses belong on an after-tax basis, and it raises them each year when the inflation adjustment box is checked.
Which inflation rate should I use?
Use a long-term average rather than last year's figure. The Consumer Price Index has averaged roughly 3% over the long run, so many planners test a range of about 2% to 3% and a higher stress case.
How can I close a retirement shortfall?
The main levers are saving more each month, delaying retirement, spending less in retirement and earning a better rate of return. Change one input at a time to see which has the biggest effect, then combine several.
Does the calculator include Social Security or a pension?
No. It models your savings only. To include Social Security benefits or a pension, subtract that expected yearly income from your expenses before entering annual retirement expenses.
Are the results guaranteed?
No. Future returns and inflation cannot be predicted with certainty, so treat the result as an estimate and rerun it with more cautious assumptions.