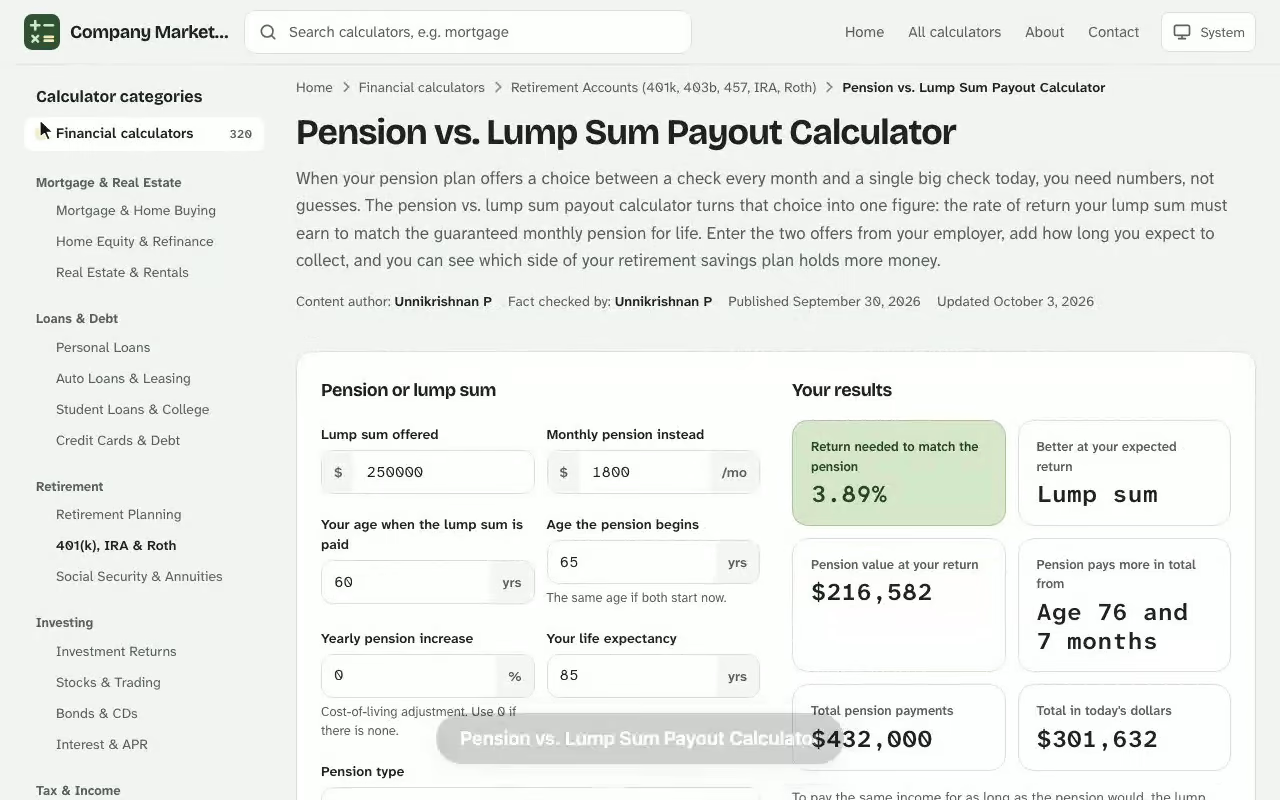
Pension vs. Lump Sum Payout Calculator. When your pension plan offers a choice between a check every month and a single big check today, you need numbers, not guesses. The pension vs. lump sum payout calculator turns that choice into one figure: the rate of return your lump sum must earn to match the guaranteed monthly pension for life. Enter the two offers from your employer, add how long you expect to collect, and you can see which side of your retirement savings plan holds more money. If you want to see how the figures change, the rmd calculator online gives you an instant result you can adjust as you go.
Your results
Return needed to match the pension
–
Better at your expected return
–
Pension value at your return
–
Pension pays more in total from
–
Total pension payments
–
Total in today's dollars
–
The required return is the yearly return the lump sum would have to earn, from the day you receive it, to pay the same income for as long as the pension would. Taxes are not included: a lump sum rolled into an IRA and a pension are both taxed as income when you draw on them.
Pension and lump sum, year by year
Pension paid each year, what it is worth in today's dollars, and what would be left of the lump sum if you invested it and paid yourself the same income.
Your age
Pension paid
In today's dollars
Total received
Lump sum balance
Results are estimates for educational purposes and are not financial, tax or legal advice.
How the Pension vs. Lump Sum Payout Calculator Compares Your Two Options
A pension offer is really two prices for the same promise. One is the monthly benefit you would collect for the rest of your life, and the other is the lump sum your employer would pay today to end its obligation, a figure plans often call the commuted value. The calculator puts both on the same footing by asking one question: if you invested the lump sum, what yearly return would it need to pay out the same monthly payments until the end of your expected lifespan? Try the free beneficiary rmd calculator current year to run your own numbers — everything is calculated in your browser and nothing you enter is stored or sent anywhere.
Unlike a generic pension calculator that only projects what you might earn, this tool compares a decision you already have in hand. It works with the figures printed on your plan's election form, so you only need the offer amount, the monthly pension, the age at which payments begin, and an age you want to plan to.
What you enter
Lump sum offer: the one-time payment your plan would send you or roll into an account.
Monthly pension: the amount of the guaranteed monthly pension at your starting age.
Starting age and planning age: when payments begin and the age you want the money to last to, often set from your life expectancy.
Cost-of-living adjustment (COLA): the yearly raise in monthly payments, or 0% if your plan has none.
Expected return: the yearly investment growth you think the lump sum could earn.
The required annual rate of return
The headline result is the required annual rate of return, the breakeven growth rate. It is the rate at which the present value of every future payment equals the lump sum. In notation, you solve for the rate \(r\) that satisfies:
Here \(L\) is the lump sum, \(P\) is the monthly pension, \(c\) is the annual COLA, \(n\) is the number of months you plan to collect and \(r\) is the yearly rate of return. Because \(r\) cannot be isolated algebraically, the calculator searches for it numerically. If you believe you can earn more than that rate after fees and taxes, the lump sum wins on paper; if you doubt it, the pension does.
Worked Example: A $438,600 Lump Sum Payout Against $2,715 in Monthly Pension Payments
Suppose you are 62 and your plan offers either a lump sum payout of $438,600 or monthly pension payments of $2,715 with no COLA. You plan for 26 years of retirement income, which brings you to age 88. Total payments over those years would be $2,715 × 312 = $847,080, almost twice the offer, but a dollar received at 80 is worth less than a dollar today, which is why present value matters. Next, open the rmd and stretch ira calculator and enter your own details to see an estimate in seconds.
Assumed return
Present value of the pension
Pension minus lump sum
Better choice on paper
0.0%
$847,080
+$408,480
Monthly pension
4.0%
$526,113
+$87,513
Monthly pension
5.5%
$450,142
+$11,542
Monthly pension
5.76% (required)
$438,600
$0
Break-even
7.0%
$389,617
−$48,983
Lump sum
The calculator reports a required annual rate of return of 5.76%. At a 5.5% assumption the pension's value is $450,142, so the guaranteed monthly pension is worth $11,542 more. At 7% the pension is worth only $389,617 and the lump sum leads by $48,983. Your answer swings on one assumption, which is why you should try several returns before choosing.
The same $2,715 monthly pension is worth anywhere from $350,188 to $558,672 depending on the return you assume and how long you live.
How long the lump sum lasts at your expected return
The calculator's required return has a mirror image in this breakeven view: at a 5.5% assumed return, the same offer is exhausted at about age 86.6. A second view is to treat the lump sum as a personal paycheck account. Invest $438,600 at 5.5% and withdraw $2,715 each month, and the balance falls to $411,084 by age 65, $278,555 by 75 and $49,137 by 85. It reaches zero at about age 86.6, which leaves a shortfall of roughly $48,073 by age 88. The same account at 7% would still hold about $300,720 at 88, so the gap between the two outcomes comes entirely from the return you earn and the market volatility you survive.
At a 5.5% return, the lump sum runs dry at about age 86.6, roughly 16 months before the planning life expectancy of 88.
The simple breakeven age
Ignoring growth, the lump sum equals $438,600 ÷ $2,715 ≈ 161.5 months, or about 13.5 years of payments. Starting at 62, that is roughly age 75. Any retiree who lives well beyond 75 collects more from the pension in raw payments. Add investment growth to the lump sum and the true breakeven moves later, to roughly age 86 at 5.5%.
Four ages frame the pension vs lump sum decision for this example.
Lump Sum vs. Monthly Pension Payments: Pros and Cons
The numbers frame the decision, but the two options also protect you from different risks. Neither is the right answer for every retiree, and these financial benefits and risks play out over decades of retirement, so the lump-sum choice usually cannot be reversed once the money is paid.
Guaranteed income and peace of mind
Much like Social Security, a pension in a defined-benefit plan promises guaranteed income that does not depend on how the stock market behaves. That steady income stream simplifies budgeting, covers living expenses such as housing and insurance, and offers real peace of mind if your longevity turns out to be long. A life annuity never runs out, however long you live.
Steady monthly payments for as long as you live, which protects against outliving your money.
No investment decisions or investment mistakes on your part.
An option to continue payments to a spouse after you pass away.
The pension keeps working if your health declines or your spending habits are poor.
See how the Pension vs. Lump Sum Payout Calculator works: change the inputs and the return needed to match the pension updates instantly. Enter your own numbers in the calculator above.
Investment control and heirs
The case for the one-time payment rests on flexibility and investment control. You choose where the funds go, can pay off debt or fund a business, and can adjust withdrawals when plans change. Anything left at your death goes to your heirs as an inheritance, which makes a lump sum a useful tool for estate planning. Most monthly pensions leave nothing to a beneficiary once the last payment is made.
Full control over spending, saving and investment of the money.
Remaining funds can pass to your beneficiaries instead of ending with you.
May suit a retiree with a shorter life expectancy due to serious health problems.
Large expenses, from a home to medical bills, can be met without waiting for monthly payments.
Market volatility, longevity and inflation
The lump sum puts risk on your side of the table. A bad first decade in the market can drain retirement savings early, and spending too freely can do the same. The pension shifts that risk to the plan, though it faces its own: a pension without a cost-of-living adjustment loses purchasing power every year as prices rise. We cover that effect below.
Checking a $312,850 Lump Sum Payout Against $1,986 Monthly Payments
Marguerite, 64, has a letter from her employer's plan administrator: a $312,850 lump sum payout or $1,986 a month starting at 65, with no cost-of-living raise. She wants to know which one holds up until age 90, so she enters 312850, 1986, a starting age of 65, a planning age of 90 and 0% for the raise, then tries a 6.0% expected return.
The result in this pension vs lump sum comparison is a required return of 5.84%. At her 6.0% guess, the pension's present value is $308,241, so the lump sum leads by just $4,609, which is too thin a margin to trust. Over 300 payments the pension would pay $595,800 in total.
She checks the offer against a named benchmark, the 4% withdrawal guideline. Four percent of $312,850 is $12,514 a year, or about $1,043 a month, against the $1,986 the plan would pay, so the lump sum would have to nearly double the guideline income to compete.
Next she reruns the calculator with 5.0%, which is closer to what her balanced IRA has realistically delivered after fees. The pension's present value jumps to $339,725, and the pension now beats the lump sum by $26,875. A 5.84% breakeven is more than she can count on, so she picks the monthly pension. Her next step is to call the plan administrator and ask for the quote with a 50% survivor benefit for her husband before she signs the election form.
Single-Life or Joint-and-Survivor Pension Payout
If you choose monthly payments, most plans ask a second question: should payments stop at your death, or continue for your spouse? That choice changes the monthly benefit you receive today, so you should enter the exact figure for each version into the calculator and compare them.
Single-life and joint-and-survivor options
A single-life pension pays the highest amount, but it stops when you die. A joint-and-survivor option pays less each month in return for continuing payments to a surviving spouse. Some single-life plans add a guarantee period, usually five or ten years, so a beneficiary is paid if you die early; the monthly amount is lower than a plan with no guarantee.
Survivor benefit ratio
The share of your pension that a surviving spouse keeps is the survivor benefit ratio. Common choices are 50%, 66%, 75% and 100%. With a 50% survivor benefit, a household that receives $2,715 would drop to $1,357.50 once one spouse dies. A higher ratio means a smaller starting payment, so ask the plan administrator for each version before you decide.
Cost-of-living adjustment and inflation
A COLA raises payments each year to follow inflation. Most private plans do not include one, so $2,715 stays $2,715 for decades. If your plan does offer a raise, enter it in the calculator; even a small yearly increase raises the pension's present value and lowers the return the lump sum must beat. Without it, 3% inflation cuts the buying power of a fixed payment by about half over 24 years.
Tax Implications and Rollover of a Lump-Sum Pension Payout
Taxes change the comparison. Monthly pension payments are taxed as ordinary income as you receive them, which spreads the taxes across many years. A lump sum paid directly to you can push a large amount into a single tax year and into a higher bracket, and may trigger withholding. These tax implications are one reason many people roll over the money.
A direct rollover of the lump sum into an IRA keeps the money tax-deferred and lets you take withdrawals on your own schedule. The IRA can name beneficiaries, so the account may pass to heirs. Because withdrawals from the IRA are taxed later, compare the pension against the after-tax value of withdrawals, not the headline offer. Also note that a pension is paid from the plan, while a rolled-over pension benefit is now your own account, so the difference in estate treatment can matter.
Factors to Consider Before Choosing Lump Sum or Annuity Payments
A calculator answers the math; your circumstances answer the rest. Work through these questions with your financial advisor before you sign an election form, because the election is almost always final.
Health and life expectancy: a longer family history of long lives favors the monthly pension, while serious illness favors the lump sum.
Other retirement income: if Social Security and other pensions already cover your living expenses, you can take more risk with a lump sum.
Financial goals: leaving money to family or funding a major purchase points to a lump sum; reliable lifetime income points to the annuity.
Years of service and plan strength: a plan that is frozen or underfunded adds risk to future payments.
Spouse and dependents: a survivor benefit may matter more than the size of the monthly check.
Plan safety and the PBGC
Private pension payments are insured up to legal limits by the Pension Benefit Guaranty Corporation, known as the PBGC. If your employer's plan fails, the PBGC pays a monthly benefit up to a cap, which may be below what your plan promised. Pensions from state and local governments are generally not covered by the PBGC. The financial strength of the plan is part of the comparison, so factor it in.
Defined-benefit plans and defined-contribution plans
Only a defined-benefit plan promises a fixed payout based on pay and years of service. A defined-contribution plan, such as a 401(k), simply holds your balance, so there is no pension to compare and no breakeven to calculate. If you have both, run the calculator on the defined-benefit offer only, then use your other accounts to judge how much retirement planning risk the lump sum adds. A retiree who has diversified accounts elsewhere can afford a bolder choice than one who depends on this pension for most monthly benefits.
Think of the calculator as the start of a major financial decision, not the end, since retirement choices like this one shape your financial stability for decades. Run it for a low, middle and high return, test each survivor option and its survivor benefits, and pair those results with your overall financial picture, your health, tax situation and family needs. Pension benefits and lump sum benefits both look best under different assumptions, and a choice that holds up across several assumptions is more trustworthy than one that works only at a single rate.
Pension vs. Lump Sum Payout Calculator questions
How does a pension vs. lump sum calculator work?
It compares the lump sum your plan offers with the present value of the monthly pension over the age you plan to reach. It also finds the yearly return your lump sum would have to earn to pay the same monthly amounts, so you can judge whether that return is realistic.
What is the required annual rate of return?
It is the breakeven growth rate. If you can earn more than that rate after fees and taxes, the lump sum should come out ahead on paper; if you expect to earn less, the monthly pension is worth more.
Should I take the lump sum or the monthly pension?
There is no single answer. The monthly pension gives guaranteed income for life and protects you from market swings, while a lump sum gives control, flexibility and a way to leave money to heirs. Your health, other income, taxes and the strength of the plan all matter.
Does the calculator account for taxes?
No. Pension payments and lump sum rollovers are taxed differently, so compare after-tax amounts. A direct rollover of a lump sum into an IRA can defer taxes, but later withdrawals are still taxable.
What is a cost-of-living adjustment (COLA) on a pension?
A COLA raises your monthly payment each year to help keep up with inflation. Most private pensions do not include one, so enter 0 unless your plan states a yearly increase.
What life expectancy should I use?
Use an age you want your income to last to, not just an average. Many planners use the late 80s or early 90s, and adjust for your health, family history and whether a spouse will depend on the income.
Can I change my mind after I choose?
Usually not. Most plans treat the election as final once the first payment is made, so confirm every figure with your plan administrator and consider speaking with a financial advisor first.