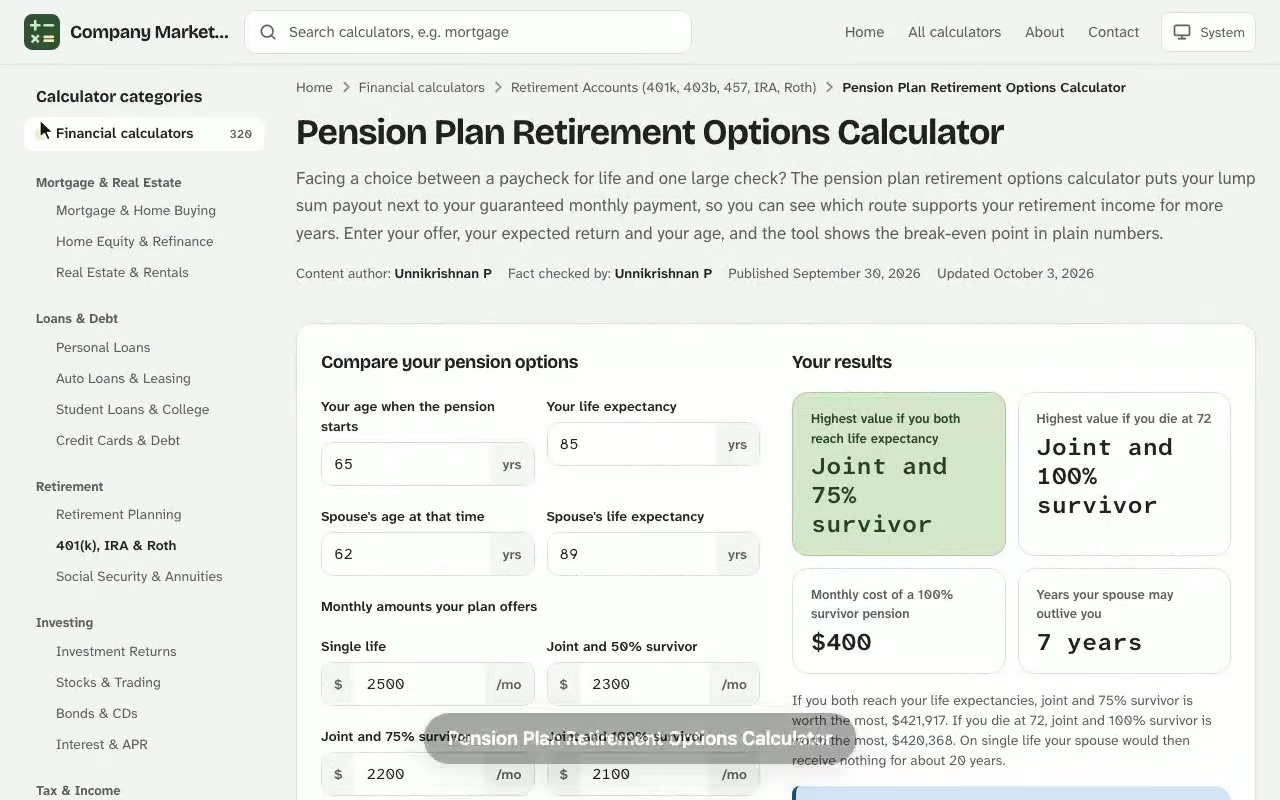
Pension Plan Retirement Options Calculator. Facing a choice between a paycheck for life and one large check? The pension plan retirement options calculator puts your lump sum payout next to your guaranteed monthly payment, so you can see which route supports your retirement income for more years. Enter your offer, your expected return and your age, and the tool shows the break-even point in plain numbers. Try the free rmd calculator to run your own numbers — everything is calculated in your browser and nothing you enter is stored or sent anywhere.
Your results
Highest value if you both reach life expectancy
–
Highest value if you die early
–
Monthly cost of a 100% survivor pension
–
Years your spouse may outlive you
–
Values are in dollars at the age your pension starts, discounted at your rate. The survivor amount is paid to your spouse after your death; the guaranteed period pays your beneficiary the full amount until the period ends. If your spouse dies first, joint options keep paying you the reduced amount.
Each option compared
Your payment, what continues after your death, and the value of each option. The last column shows how long you would need to live for single life to come out ahead.
Option
You receive
After your death
Value, life expectancy
Value, early death
Single life wins if you live past
Value by your age at death
What each option is worth to your household depending on when you die, assuming your spouse lives to their life expectancy.
Your age at death
Single life
Joint 50%
Joint 75%
Joint 100%
Guaranteed period
Results are estimates for educational purposes and are not financial, tax or legal advice.
How a Pension Plan Retirement Options Calculator Works
A pension plan usually hands you a one-time decision at retirement: take a lump sum you invest yourself, or accept a stream of monthly payment amounts for as long as you live. Neither choice is obviously better. The answer depends on your health, your life expectancy, the rate of return you can realistically earn and how much you need from your pension benefit each month. This calculator turns those moving parts into one comparison, much like a retirement calculator does for savings, only it focuses on the payout options your employer actually offers. Pair this with the free roth ira conversion calculator for a fuller picture before you make a decision.
Inputs You Enter
Most people already hold every number they need in the benefits packet their plan administrator mailed them. Gather these before you start:
Lump sum offer: the one-time amount the pension plan will pay today.
Monthly payment: the annual pension benefit divided by twelve, for the single-life option and for any survivor option.
Retirement age: the age you start collecting, since a younger start means early retirement and a longer payout.
Years of retirement income: how long you want the money to last, anchored to your life expectancy.
Expected inflation and whether the pension increases with inflation each year.
Marital status: a spouse changes which payout options make sense.
Results You Get Back
The tool reports three things: the break-even age, the annual rate of return your lump sum must earn to match the pension, and the monthly income your savings balance could fund if you invested the lump sum instead. Together they form a benefit estimate you can test against your own retirement goals rather than a vague hunch.
Pension vs Lump Sum Payout Calculator Formulas
Two formulas drive a pension vs lump sum payout calculator. The first ignores growth and simply asks how many years of payments equal the lump sum: Pair this with the beneficiary rmd calculator online for a fuller picture before you make a decision.
The second treats the lump sum as the present value of the monthly payments, then solves for the monthly rate \(i\) that makes the two equal:
$$L = P \times \frac{1-(1+i)^{-n}}{i}$$
See how the Pension Plan Retirement Options Calculator works: change the inputs and the highest value if you both reach life expectancy updates instantly. Enter your own numbers in the calculator above.
Here \(L\) is the lump sum, \(P\) is the monthly payment, \(i\) is the monthly rate of return and \(n\) is the number of months you expect to collect. Multiply \(i\) by 12 to get the yearly figure. A higher result means the pension is worth more, because your own investment returns would need to be that strong to keep pace with it.
The reverse question is just as useful: what monthly retirement income can a given lump sum fund at a chosen return over a chosen number of years? The same formula solved for \(P\) answers it, and the table below shows several combinations for the worked example that follows.
Worked Example: Lump Sum Payout vs Guaranteed Monthly Payment
Suppose you are 62 and your plan offers three payout options: $2,847 per month for your lifetime, $2,513 per month with a 50% survivor benefit for your spouse, or a lump sum payout of $438,600 today. The single-life option pays $34,164 a year, which is 7.79% of the lump sum.
Break-Even Age Without Growth
Divide $438,600 by $34,164 and you get 12.8 years, so the single-life pension overtakes the lump sum at age 74.8. The joint option needs 14.5 years, or age 76.5. Because this calculation ignores growth, it is a floor: it tells you the earliest point the payments add up to the lump sum, not the point where the decision becomes safe.
Key ages in the example: break-even, joint break-even and the point a 5.2% lump sum runs out.
Rate of Return Needed to Match the Pension
Now add growth. If you want to collect to age 87, the lump sum must earn 6.08% a year to match the single-life payment. Plan on collecting to age 82 and the required return falls to 4.80%; to age 92 it climbs to 6.76%. The joint option asks for less because it pays less, at 4.80% by age 87.
Return a lump sum must earn to match each pension option, by payout horizon.
Collect until
Years
Single-life return needed
Joint 50% return needed
Age 82
20
4.80%
3.36%
Age 87
25
6.08%
4.80%
Age 92
30
6.76%
5.58%
Run the other direction and the picture is equally clear. A lump sum invested at 5% and drawn down over 25 years supports only $2,564 a month, which is $283 short of the pension. Not until the return reaches 6% does the lump sum come close, at $2,826 a month. If you instead followed a 4% withdrawal rate on the $438,600 and never touched principal, you would draw $17,544 a year, or $1,462 a month.
Retirement Calculator with Pension: Reading the Results
A retirement calculator with pension inputs gives you numbers, but the interpretation is yours. Start with the shortfall test: does the pension, plus Social Security, cover the essentials? If the monthly pension benefit comfortably pays for housing, food and insurance, the guaranteed route removes market performance from your core budget. If it falls short, the lump sum may let you build a bridge with additional savings.
Longevity and Spending Habits
The case for the pension strengthens with longevity, and the calculator shows it directly: raising the years of payments you enter moves both the break-even age and the return the lump sum must earn. Every extra year of life is another year of full payments, while a lump sum can run dry. In the example, a lump sum earning 5.2% and paying out $2,847 a month lasts only 21.3 years, which ends around age 83. Your spending habits matter as well: a retiree who withdraws steadily can be hurt by a poor first few years in the market, an effect that guaranteed income avoids, so run the lower-return rows of the scenario table before you decide.
Spouse, Survivor Benefits and Marital Status
If you are married, the survivor option is a form of insurance. You give up $334 a month ($2,847 minus $2,513), and in return your spouse keeps $1,257 a month after you die. Single retirees usually skip that cost, which is why marital status sits at the top of the input list.
Lump Sum Payout vs Monthly Pension: A Plant Supervisor Runs the Numbers
At 63, a water-treatment plant supervisor gets a buyout packet from the county: $312,480 today, or $2,106 a month for life. The envelope also warns that a cash payout that skips a direct rollover has 20% withheld, which would be $62,496 gone before a single investment decision.
Before signing, the supervisor opens the pension options calculator and types in both figures, a 22-year horizon to age 85, and 5% as the long-run return on the existing IRA. The first result is 12.4 years: with no growth, the monthly checks pass the lump sum at age 75.4. The second result matters more. To fund $2,106 a month through age 85, the lump sum would need to earn 5.85% a year, above the 5% assumption.
A second check applies the 4% withdrawal guideline to the lump sum: $12,499 a year, or $1,042 a month, against $25,272 a year from the pension. The gap is too wide for a spending plan built on rent, a truck loan and health insurance premiums.
The supervisor shortlists the monthly option as the income floor.
The county is asked for the 50% joint-and-survivor quote.
The comparison is rerun with that lower payment, since a spouse is involved.
The decision is not made on a feeling about markets. It turns on one number, 5.85%, and on whether a 5% portfolio can plausibly reach it over 22 years.
Factors That Change Your Retirement Savings Calculator Results
No retirement savings calculator can predict the future, so treat each output as a range and test the assumptions behind it. These are the variables that move the answer most:
Inflation: a pension that does not rise with the cost of living loses purchasing power every year, while an inflation-adjusted benefit holds its value.
Risk: a lump sum placed in stocks and mutual funds can grow faster, but it can also fall just before you need it.
Taxes: a lump sum rolled into an IRA defers taxes, while a cash payout can trigger a large bill in one year.
Unexpected expenses:medical bills and home repairs hit a fixed pension harder than a flexible account.
Full retirement age: claiming Social Security benefits at 62 permanently reduces them, which raises how much your pension must cover.
Employer terms: some plans offer cost-of-living increases, others offer none.
Retirement Planning Tool Scenarios Worth Running
The real power of a retirement planning tool is the what-ifs. Run the lump sum at 4%, 5% and 6% and compare each result with your pension. Raise expected inflation by a point. Shorten the horizon to 20 years, then stretch it to 30. These scenarios show whether the pension wins narrowly or by a wide margin.
Return on lump sum
20 years
25 years
30 years
4%
$2,658
$2,315
$2,094
5%
$2,895
$2,564
$2,354
6%
$3,142
$2,826
$2,630
Compare each cell with the $2,847 pension. Only the 20-year column at 5% or better ($2,895 and $3,142) beats it. Over 30 years, even a 6% return falls $217 short. That asymmetry is the heart of the decision: the pension protects the long tail of your life, and the lump sum rewards a shorter one.
Monthly income a $438,600 lump sum supports, compared with the $2,847 pension.
Combining Your Pension with Other Retirement Savings
Your pension is one layer of a broader financial plan. Add it to Social Security, your current savings in 401(k) and IRA accounts, and any earnings from part-time work. A common check is income replacement: what share of your pre-retirement pay do all the sources add up to? Many planners aim for 70% to 80%.
If the total comes up short, you can close the gap with more monthly savings, a higher savings rate before you retire, or a later start date. Households should use household income rather than one salary, and should count annual savings from both partners. Before you build your nest egg around a single projection, remember that pre-retirement investment returns and post-retirement returns are assumptions, not promises. A conservative retirement strategy plans for the lower number.
This is also the right moment to bring in a financial advisor. An advisor can confirm the tax treatment of a rollover, check the plan's survivor rules, and stress-test your retirement plan against your budget across the retirement years you expect to fund. Treat the calculator as the starting point for that conversation and the advisor as the second opinion on any investment decision that follows.
Pension Plan Retirement Options Calculator questions
Should I take the pension lump sum or monthly payments?
It depends on your health, life expectancy, other income and how much investment risk you can carry. Compare the annual return a lump sum must earn to match the monthly payment: the longer you expect to collect, the higher that return, and the stronger the case for guaranteed income.
What is the break-even age on a pension?
It is the age at which total monthly payments equal the lump sum if the lump sum earned no growth: lump sum divided by annual pension benefit, added to your retirement age. It is a minimum, not a safe point.
What return does a lump sum need to match my pension?
The calculator solves for the annual rate of return at which the lump sum, drawn down monthly over your chosen number of years, equals the pension payment. A higher result favors the pension.
How does inflation change my pension decision?
A pension that does not increase with inflation loses purchasing power every year. Switch the inflation option to see how rising costs widen the savings you need.
How is the total retirement savings needed calculated?
The tool takes the share of income you want to replace, grows it with expected inflation, subtracts pension and any included Social Security benefits each year, and discounts the remaining gap at your post-retirement return.
Should I include Social Security in the calculation?
Include it if you expect to claim benefits. Enter the annual estimate from your Social Security statement; leaving it out gives a more conservative savings target.
What if I am married?
A single-life pension pays more per month but stops at your death. If you have a spouse, compare the joint-and-survivor option your plan offers before choosing.