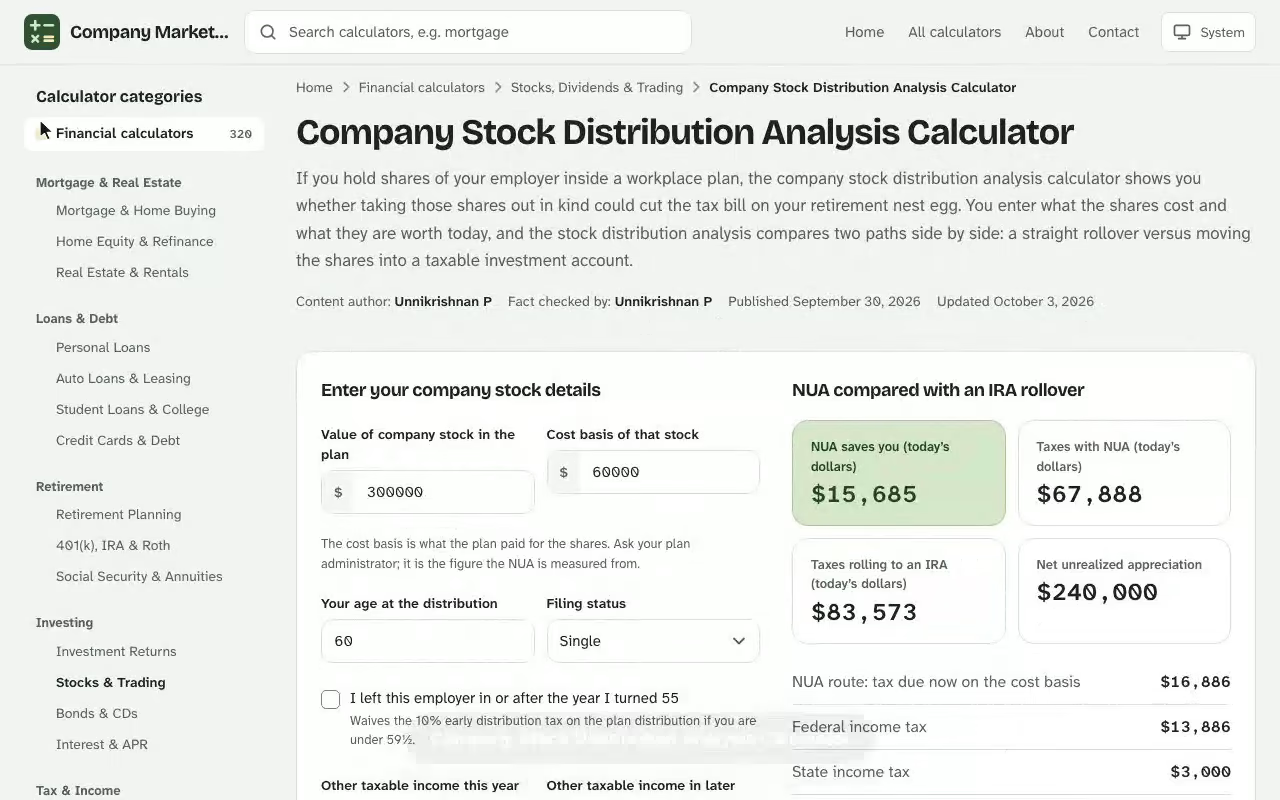
Company Stock Distribution Analysis Calculator. If you hold shares of your employer inside a workplace plan, the company stock distribution analysis calculator shows you whether taking those shares out in kind could cut the tax bill on your retirement nest egg. You enter what the shares cost and what they are worth today, and the stock distribution analysis compares two paths side by side: a straight rollover versus moving the shares into a taxable investment account. Pair this with the pivot point calculator for a fuller picture before you make a decision.
NUA compared with an IRA rollover
NUA saves you (today’s dollars)
–
Taxes with NUA (today’s dollars)
–
Taxes rolling to an IRA (today’s dollars)
–
Net unrealized appreciation
–
NUA route: tax due now on the cost basis
–
Federal income tax
–
State income tax
–
10% early distribution tax
–
NUA route: total taxes, all years
–
IRA route: total taxes, all years
–
NUA route: cash after taxes
–
IRA route: cash after taxes
–
NUA treatment needs a lump-sum distribution: your whole balance from the employer’s plans of that kind, paid within one tax year, after you leave the employer, reach 59½, become disabled (self-employed) or die. The rest of the plan can still be rolled over to an IRA.
“Today’s dollars” discounts each year’s tax at the stock’s growth rate, because tax paid now costs you the growth on that money. Uses 2026 federal brackets for every year and ignores dividends.
Tax by year
The amount sold or withdrawn each year and the tax under each route.
Year
Sold or withdrawn
Tax with NUA
Tax with IRA rollover
Results are estimates for educational purposes and are not financial, tax or legal advice.
In-Kind Distribution of Company Stock Explained
A retirement plan normally taxes every dollar withdrawn as ordinary income, no matter how much of it is investment earnings. Employer shares are the exception. A special set of rules lets you take an in-kind distribution, which means the actual shares move out of the plan instead of being sold inside it. When you do that, a significant portion of the growth can be taxed at a lower rate than your paycheck. Pair this with the expected return calculator online for a fuller picture before you make a decision.
See how the Company Stock Distribution Analysis Calculator works: change the inputs and the nua saves you (today’s dollars) updates instantly. Enter your own numbers in the calculator above.
Moving Shares from a Retirement Plan to a Taxable Investment Account
The shares leave your retirement plan and land in a taxable investment account at a brokerage. You owe ordinary income tax right away, but only on the plan's original cost of the shares. The gain that built up while the plan owned them, often called net unrealized appreciation, is not taxed until you sell. Any shares you keep in the taxable account then sit exposed to market swings like any other holding, so the move works best when you have a plan for what happens next.
Why Long-Term Capital Gains Beat Ordinary Income
Wages and rollover withdrawals are taxed as ordinary income, and ordinary income tax rates climb as high as 37%. The long-term capital gains schedule tops out far lower, so the same dollar of growth costs you less when it falls under the long-term capital gains tax rate. That gap between the two schedules is the entire engine of the calculation. Use an income tax rate that matches your actual bracket, since a lower bracket shrinks the advantage.
How the Company Stock Distribution Analysis Calculator Works
The tool runs the same arithmetic you would do on paper. It splits the market value of your company stock into two pieces, taxes each piece at its own rate, and subtracts the total from the value you started with: The inflation adjusted return calculator is free to use with no sign-up, and works on desktop and mobile.
Here \(V\) is the market value of the shares, \(B\) is the cost basis, \(r_{o}\) is your ordinary income rate and \(r_{g}\) is the capital gains tax rate. The rollover alternative is simpler: \(V \times r_{o}\), because everything withdrawn is ordinary income.
Inputs You Enter
Market value of the employer shares in your plan
Cost basis the plan paid for them
Your ordinary tax rate and the capital gains rate that applies to you
Whether state and local taxes should be added to each rate
Press the button, and the report lays out the tax due now, the tax due later, and the capital gains taxes you avoid compared with a rollover. Like other interactive calculators offered as self-help tools, it gives an estimate, so confirm the final numbers with your plan administrator.
Worked Example: Stock Rollover Versus an In-Kind Distribution
Take a plan holding 3,250 shares priced at $127.00 each, so the market value is $412,750. The plan paid $86,400 for them. Your ordinary rate is 32% and your capital gains rate is 15%. A stock rollover into an IRA followed by a full withdrawal would be taxed entirely as ordinary income. The in-kind route splits the bill.
Step
In-kind distribution
Rollover and withdrawal
Taxed as ordinary income today
$86,400 at 32% = $27,648.00
$412,750 at 32% = $132,080.00
Taxed as capital gain when sold
$326,350 at 15% = $48,952.50
None
Total tax
$76,600.50
$132,080.00
Net after tax
$336,149.50
$280,670.00
The in-kind route keeps $55,479.50 more in your pocket, which is the $326,350 gain multiplied by the 17-point gap between the two rates.
Reading the Capital Gains Tax Line
The $48,952.50 line is a capital gains tax you only pay on the day you sell, which means timing is yours to control. Waiting more than a year after the distribution keeps any further growth in the long-term bucket, too. Growth that happens after the shares leave the plan is taxed on its own schedule, and that is why the tool reports the gain at the moment of distribution.
Concentrated Stock Position Risk and Diversification
A concentrated stock position means one holding dominates your balance. Many people end up there because they work for a current or former employer, while for others the shares arrived through a merger or an acquisition, or one name kept outperforming everything else. Whatever the cause, a single company setback can damage your financial well-being, and Lehman Brothers and Enron are the usual reminders. Most advisors suggest prudent limits, commonly no more than 10% of your portfolio value in a single stock.
Selling Low-Cost Stock Without a Surprise Tax Bill
The obstacle to diversifying is often low-cost stock: a sale of stock in a taxable account triggers the full gain at once, plus tax and transaction costs. An in-kind move lets you spread the decision across years. For any stock position with a large embedded gain, that flexibility lets you reduce exposure in stages and supports risk reduction without forcing a single huge taxable event, and diversification can then happen at a pace you pick. Running each staged sale through the tool shows the tax cost of every step before you commit to it.
Testing an In-Kind Distribution on 2,415 Plan Shares
Priya is leaving her employer after eleven years and has a 401(k) statement open beside her. It lists 2,415 shares of company stock at $81.20, worth $196,098, and the plan paid an average of $17.08 per share, a cost basis of $41,248.20. Her whole household portfolio is about $612,000, so the employer's shares are roughly 32% of it, far above the 10% guideline she keeps seeing.
She enters those three numbers, a 24% ordinary rate and a 15% long-term rate into the calculator and reads the result.
Tax now on the basis: $41,248.20 at 24% = $9,899.57
Tax later on the $154,849.80 gain, once sold: 15% = $23,227.47
Total: $33,127.04, versus $47,063.52 if she rolls everything to an IRA and withdraws it as ordinary income
The distribution analysis shows an in-kind distribution saving her $13,936.48, which equals the gain times the nine-point gap between the two rates. That is the figure that settles the question, so she asks the plan administrator for a distribution of the shares rather than a cash-out.
Next she changes one input. To get under 10% of the portfolio she needs to sell enough that no more than about $61,200 remains. Selling 1,700 shares leaves 715 shares worth $58,058, or 9.49%. The gain realized on those 1,700 shares is $109,004 ($64.12 each), so the capital gains tax from that sale is $16,350.60, and she plans to schedule the sale after the one-year holding period.
Where the Proceeds Go After You Sell
Selling the shares only solves half of the problem, because the money still needs a home that keeps the tax on your remaining gain in view. Many people lean on fixed income to dampen swings, which means weighing interest rates, credit quality, duration and liquidity. Municipal bonds are tax-exempt at the federal level but can still trigger the alternative minimum tax. A fund tracking the S&P 500 spreads you across 500 companies, though volatility remains, and a broad market index is the benchmark most funds are measured against. Compare the fees and charges of any fund or ETF you consider, and remember that past performance of an index or a manager says little about next year's performance.
Taking Periodic Distributions Later
If the sale will fund your living costs, periodic distributions from the proceeds become the next question: how long does a balance last when you draw a fixed amount each periodic interval? Your estate plans matter here too, since heirs generally treat inherited holdings differently from an inherited plan balance, and that can change which route leaves the most behind.
Related Tools: Stock Calculator and Investment Calculator Options
Neighboring tools answer different questions. A stock calculator or stock investment calculator replays historical prices as an investment simulation: you enter an investment amount, pick a start date and add an optional periodic contribution. Switch on the option to reinvest dividends and a dividend reinvestment plan speeds up compounding, because each dividend buys more shares that earn a dividend of their own. A generic investment calculator projects growth in a similar way, the investment distributions tool works in the opposite direction, and a stock position calculator measures how heavily one holding weighs on a portfolio. None of them applies the special set of rules for employer shares, which is what a distribution analysis calculator built for plan stock adds, and why a stock distribution analysis belongs beside them rather than in place of them.
Limits of the Estimate and Tax Law Changes
Every figure above is hypothetical and offered for illustrative purposes. Nobody can guarantee the accuracy of a projection, because tax law, investment trends and your personal circumstances keep changing. The results are not tax advice or investment advice, and they do not replace personal finance guidance tailored to you. Before you act on company stock distribution numbers, review them with a financial advisor and a legal advisor who can confirm the plan's paperwork. The benefit depends on your earnings, your cost basis, and whether you leave a significant portion of the stock in the plan. Also weigh the rate you expect to pay in later years, since the capital gains rate and state taxes can change.
Questions About Employer Stock in a Plan
Can you take in-kind treatment on only some of the shares? Often yes, and the plan administrator can confirm which lots are eligible, since a mistake there is hard to unwind. Do gains and losses on separate lots net against each other inside the plan? Not in the way they do in a taxable account, so ask your plan recordkeeper or one of the brokerages you use for lot-level cost basis, because a statement that shows only a market total hides the split this analysis needs. And if you own stocks, bonds or a share in other accounts, check each account separately: an investor with a small holding (many investors have one) of employer's company stock in a second account can overlook it, and planning for retirement works best when every distribution and every capital gain is counted once.
Company Stock Distribution Analysis Calculator questions
What is a company stock distribution analysis?
It compares two ways of getting employer shares out of a retirement plan: an in-kind distribution into a taxable account, or a rollover followed by withdrawals taxed as ordinary income.
What is net unrealized appreciation?
It is the gain that built up while the plan held the shares, which is the market value minus the plan's cost basis. Under the special rules it is taxed at capital gains rates when you sell.
Do I owe tax on the day of the distribution?
Yes, ordinary income tax is due on the cost basis in the year of the distribution. The gain is taxed only when the shares are sold.
Why does the calculator ask for state and local taxes?
State and local taxes can apply on top of the federal rates. Entering a combined rate gives a more realistic comparison, and leaving it at 0 shows the federal-only result.
Can the in-kind route ever cost more than a rollover?
The gap between the ordinary and capital gains rates drives the savings. When your cost basis is close to the market value, or the two rates are similar, the advantage shrinks.
Is the result tax advice?
No. It is a hypothetical estimate for illustration. Confirm plan rules and your numbers with a financial advisor or tax professional.
Why diversify away from employer stock?
Holding too much of one company, commonly more than about 10% of a portfolio, ties your finances to a single company's fortunes.