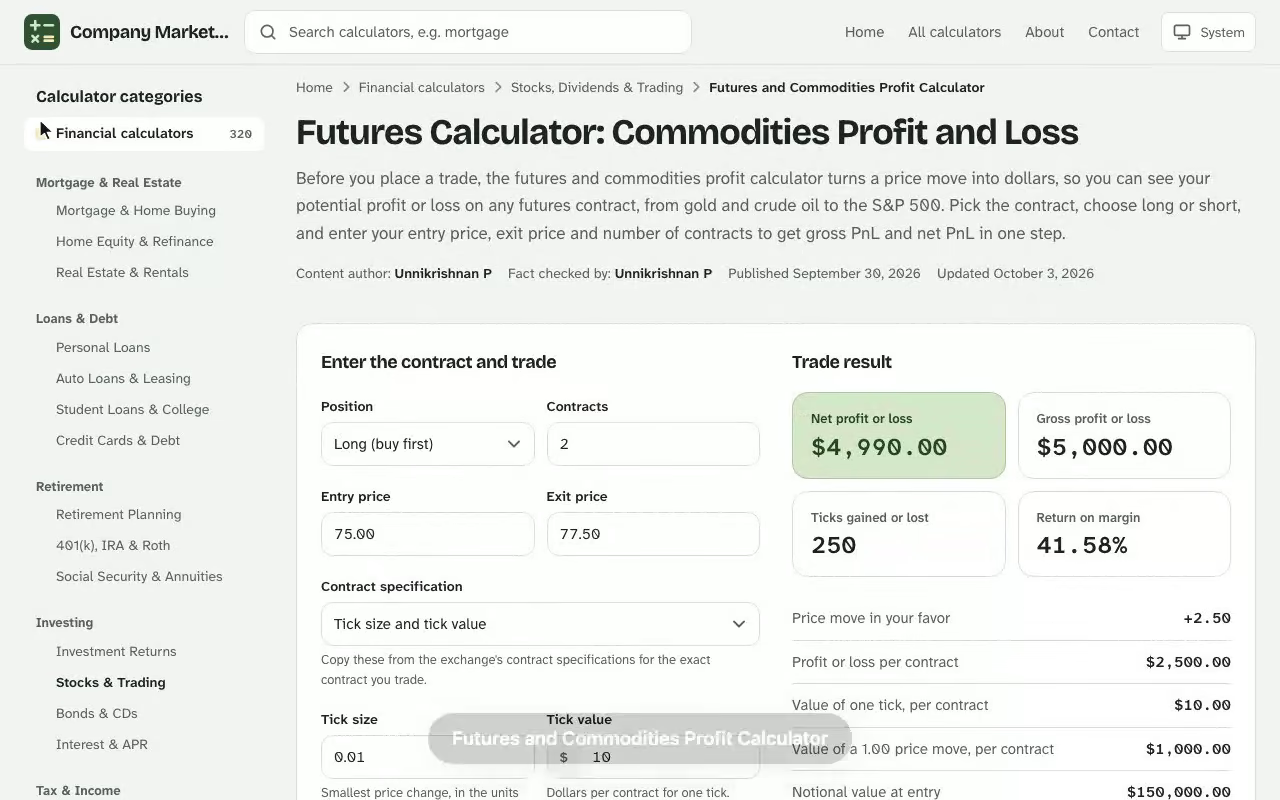
Futures and Commodities Profit Calculator. Before you place a trade, the futures and commodities profit calculator turns a price move into dollars, so you can see your potential profit or loss on any futures contract, from gold and crude oil to the S&P 500. Pick the contract, choose long or short, and enter your entry price, exit price and number of contracts to get gross PnL and net PnL in one step. If you want to see how the figures change, the free pivot point calculator gives you an instant result you can adjust as you go.
Trade result
Net profit or loss
–
Gross profit or loss
–
Ticks gained or lost
–
Return on margin
–
The price change is not a whole number of ticks. Check the tick size and prices against the contract specifications.
Price move in your favor
–
Profit or loss per contract
–
Value of one tick, per contract
–
Value of a 1.00 price move, per contract
–
Notional value at entry
–
Total initial margin
–
Margin as % of notional value
–
Effective leverage
–
Round-trip commissions and fees
–
Breakeven exit price
–
Losses on a futures position can exceed the margin deposited. These figures ignore daily mark-to-market cash flows, maintenance margin calls and slippage.
Results are estimates for educational purposes and are not financial, tax or legal advice.
How a Futures Calculator Turns Price Movement into Dollars
A futures calculator multiplies how far the market moved by what each point is worth. Every futures contract has a fixed contract size set by its exchange, and that size decides how many dollars one tick or one point is worth. Because the contract is standardized, the same price move produces the same dollars for every trader holding the same number of contracts. That predictability is what makes a profit calculator so useful for traders who need an exact answer before they commit capital. The capm calculator online is free to use with no sign-up, and works on desktop and mobile.
Futures are standardized agreements to buy or sell an underlying asset at a set price on a future date. Traders use them to hedge price volatility in physical holdings or to speculate on direction, and most positions are closed before expiration, which is why the calculator reports PnL rather than delivery value.
Inputs you enter
Contract: the instrument you trade, which fills in the tick size and point value for you.
Direction: long if you expect the price to rise, short if you expect it to fall.
Entry price and exit price: where the trade opens and where it closes or where you plan to take profit.
Number of contracts: how many contracts you hold.
Commission per side: the broker fee you pay once to enter and once to exit.
Results you get back
The calculator returns the points moved, the ticks moved, gross PnL, commissions, net PnL and the result per contract. Some versions add the notional value of the position and a risk reward ratio when you also supply a stop loss and a take profit level.
Futures and Commodities Profit Calculator Formula
The core relationship is the same for a long position in any market: The futures contracts margin calculator uses the same plain-English approach, so you can compare results side by side.
A tick is the smallest price step a contract can make, and the tick value is what that step is worth in dollars. The point value is the dollar worth of a full one-point move, which equals the tick value divided by the tick size. For gold the tick size is 0.10 and the tick value is $10, so one point is worth $100.
Long and short trades
Going long means buying first and selling later; going short means selling first and buying back later. Both directions use the same point value, only the sign of the price difference changes.
Worked Example with a Gold Commodities Profit Calculator
Suppose you buy 3 gold futures contracts at 3,412.60 and sell them at 3,438.90. Gold has a point value of $100, and your broker charges $2.10 per side.
Step
Calculation
Result
Points moved
3,438.90 − 3,412.60
26.3 points
Ticks moved
26.3 ÷ 0.10
263 ticks
Gross PnL
26.3 × $100 × 3
$7,890.00
Round-trip commission
$2.10 × 2 × 3
$12.60
Net PnL
$7,890.00 − $12.60
$7,877.40
Per contract, the trade earned $2,625.80 after fees. If you had been short the same contracts with the same prices, the same arithmetic would produce a loss of $7,902.60 once commission is added.
Net PnL on 3 gold contracts bought at 3,412.60 across a range of exit prices.
Gross PnL vs net PnL
Gross PnL is the result before any trading costs, while net PnL is what you keep after commissions and fees. On a small move, the gap matters: a 2-point gold move earns $600 gross on 3 contracts, and $12.60 of that disappears to commission.
How $7,890.00 of gross PnL becomes $7,877.40 of net PnL.
Contract Specifications for Popular Commodity Calculator Markets
A commodity calculator needs the right specifications to be accurate, and the exchange publishes them for every contract. The table below lists the standard values you will see most often. Standard E-mini and Micro E-mini index contracts trade on the CME, and a micro contract carries one-tenth of the point value of its full-size sibling.
Market
Contract
Tick size
Tick value
Point value
Exchange
Metals
Gold
0.10
$10.00
$100
COMEX
Metals
Micro Gold
0.10
$1.00
$10
COMEX
Metals
Silver
0.005
$25.00
$5,000
COMEX
Metals
Copper
0.0005
$12.50
$25,000
COMEX
Energy
Crude Oil
0.01
$10.00
$1,000
NYMEX
Energy
Natural Gas
0.001
$10.00
$10,000
NYMEX
Agriculture
Corn
0.25
$12.50
$50
CBOT
Agriculture
Soybeans
0.25
$12.50
$50
CBOT
Agriculture
Wheat
0.25
$12.50
$50
CBOT
Stock indexes
E-mini S&P 500
0.25
$12.50
$50
CME
Stock indexes
E-mini Nasdaq
0.25
$5.00
$20
CME
Currencies
Euro FX
0.00005
$6.25
$125,000
CME
Treasuries
10-Year T-Note
1/64
$15.625
$1,000
CBOT
Reading the table for a short crude oil trade
Say you sell 2 crude oil contracts short at 71.46 and buy them back at 70.82. The price fell 0.64 points, so the trade earns 0.64 × $1,000 × 2 = $1,280 before fees. The same 0.64 move on one corn contract would be worth only $32, which is why checking the point value before sizing a trade matters.
Checking a Soybean Short with a Commodity Profit Calculator
A grain merchant expects the harvest to push soybean prices lower, so you follow the logic and sell 5 CBOT soybean contracts short at 1,046.50 cents per bushel. Before entering, you want the profit and loss in dollars, not cents. Soybeans move in 0.25-cent ticks worth $12.50, and one full cent is worth $50 per contract.
You open the calculator and select soybeans, choose short, type 1,046.50 as the entry price and 1,031.25 as the exit price, set 5 contracts and enter $2.40 commission per side. The calculator reports a 15.25-cent move, which is 61 ticks. Gross PnL is 15.25 × $50 × 5 = $3,812.50. Round-trip commission is $2.40 × 2 × 5 = $24.00, so net PnL is $3,788.50.
Because the tick value is published by the exchange, you can check the screen yourself: 61 ticks × $12.50 × 5 contracts is the same $3,812.50. The figure then drives one specific decision. You want at least $2,000 net on the trade, so you rerun the calculation with the exit at 1,038.00. That 8.5-cent move produces $2,125.00 gross and $2,101.00 net, which clears your floor, so you set the buy-to-cover order at 1,038.00 and keep a second order at 1,031.25 for the rest of the move.
Futures Trading Risk Management and Position Size
Knowing your potential profit and loss is only half of risk management. The other half is deciding how many contracts to hold so that one losing trade stays inside the maximum risk you chose. Most traders risk one to two percent of their account size per trade, and the position sizing formula is simple:
See how the Futures and Commodities Profit Calculator works: change the inputs and the net profit or loss updates instantly. Enter your own numbers in the calculator above.
With a $60,000 account risking 1%, your maximum risk is $600. You plan to buy at 3,412.60 with a stop loss at 3,404.20, an 8.4-point stop. On a full gold contract that stop costs 8.4 × $100 = $840 per contract, which already exceeds your limit, so the answer is zero. On the micro contract it costs 8.4 × $10 = $84, and $600 ÷ $84 allows 7 contracts with $588 at risk.
Micro gold contracts allowed at 1% risk, by account size and stop distance.
Risk reward ratio
The risk reward ratio compares the distance to your take profit with the distance to your stop. A 25.2-point target against that 8.4-point stop gives 3 to 1, meaning you earn three dollars of potential profit for each dollar of potential loss.
Using a Futures PnL Calculator in Your Futures Trading Strategy
A futures pnl calculator belongs in your trading strategy before the order goes in, not after. Enter a hypothetical order, compare the result against the stop-loss you would place, and decide whether the trade is worth taking. A free futures calculator costs nothing to repeat, so you can test ten entries in the time one live trade takes. Futures trading rewards that kind of preparation, because futures prices move in fixed steps, and the minimum tick of each contract has a set dollar value.
Choosing between calculator types
A futures p&l calculator answers what a trade will earn, while a position size tool answers how many futures contracts you can afford to hold. A general trading calculator or profit/loss calculator often offers both on one screen, and the same logic runs inside a pnl calculator for stocks, although futures add a point value and a contract size. A broker's CFD trading profit calculator adds the spread, a conversion fee and overnight swaps to the same price-difference formula, and quotes size in units such as barrels. A futures profit calculator for exchange-traded contracts needs none of those lines, and a commodity profit calculator built for CFDs is the one to use when your broker quotes them.
Futures in a wider portfolio
Whether you use futures for speculation, to hedge a physical holding, or as one sleeve of a wider portfolio, the calculator expresses every position in the same unit, dollars, so a gold trade and an index trade compare on equal terms. The CFTC requires large positions in some contracts to be reported, but that reporting never changes the PnL figure the calculator returns.
Costs a Profit Loss Calculator Does Not Include
A profit loss calculator shows the trade you planned, not the trade you got. Several real costs sit outside the formula, and each one reduces the figure you actually keep.
Exchange fees and regulatory pass-through charges, which vary by broker and contract.
Slippage, the gap between the price you wanted and the price you were filled at.
Margin and margin requirements, which brokers can raise in volatile weeks, and leverage: a small deposit controls a large position, so gains and losses both scale up, and a margin call can force you out early.
Trading costs such as data and platform fees, which depend on your setup.
Futures trading carries substantial risk, and this calculator is for education, not trading advice. Practice with a demo account before committing real capital.
Cash settlement and physical delivery
Some contracts settle in cash while others call for physical delivery of the commodity. The PnL calculation assumes you close before the delivery month, so any delivery charges from holding past it fall outside the figure the calculator returns.
Futures and Commodities Profit Calculator questions
How do you calculate profit and loss on a futures trade?
Subtract the entry price from the exit price (reverse it for a short), then multiply by the contract's point value and the number of contracts. Subtract round-trip commissions to get net PnL.
What is the difference between a tick and a point?
A tick is the smallest price step a contract can make, and a point is a full unit of price. Point value equals tick value divided by tick size, so gold's $10 tick of 0.10 gives a $100 point.
What is the difference between gross PnL and net PnL?
Gross PnL is the profit or loss from price movement alone. Net PnL subtracts commissions, which are charged per side, so each contract pays twice on a round trip.
How many contracts should I trade for my account size?
Multiply account size by the percentage you are willing to risk, then divide by the stop distance times point value, rounding down. Many traders risk one to two percent per trade.
What is the difference between E-mini and Micro E-mini contracts?
Micro contracts are one-tenth the size of their E-mini versions, so the same price move is worth a tenth as much. That makes them practical for smaller accounts.
Does this calculator include exchange fees, slippage or margin?
No. It uses the commission you enter. Exchange fees, regulatory charges, slippage and broker margin requirements vary and are not included.
Can I use it for short trades?
Yes. Choose Short and the price difference is reversed, so a falling market produces a gain and a rising market a loss.