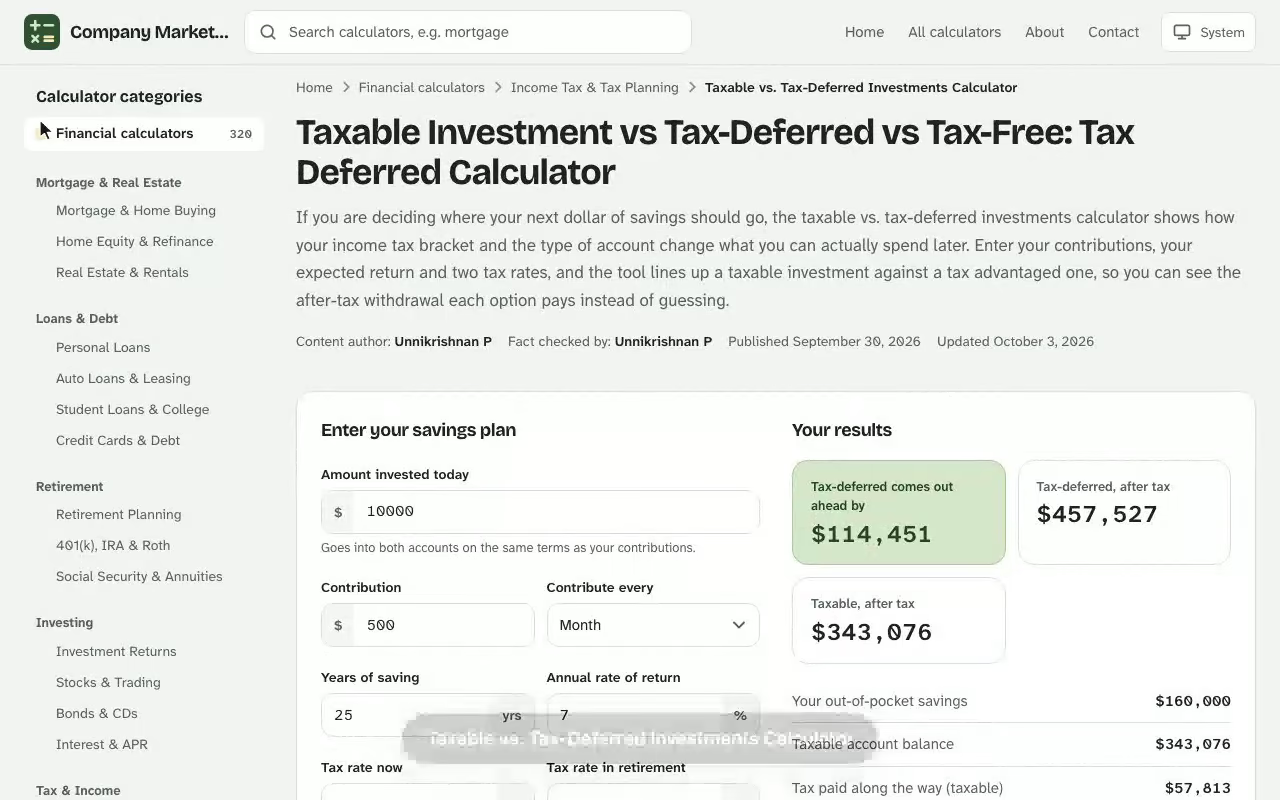
Taxable vs. Tax-Deferred Investments Calculator. If you are deciding where your next dollar of savings should go, the taxable vs. tax-deferred investments calculator shows how your income tax bracket and the type of account change what you can actually spend later. Enter your contributions, your expected return and two tax rates, and the tool lines up a taxable investment against a tax advantaged one, so you can see the after-tax withdrawal each option pays instead of guessing. Next, open the free income tax calculator and enter your own details to see an estimate in seconds.
Your results
Tax-deferred comes out ahead by
–
Tax-deferred, after tax
–
Taxable, after tax
–
Your out-of-pocket savings–
Taxable account balance–
Tax paid along the way (taxable)–
Capital gains tax when sold–
Tax-deferred account balance–
Tax due when withdrawn–
After-tax income from taxable–
After-tax income from tax-deferred–
Balances grow monthly. Yearly tax on the taxable account is paid out of that year's earnings. Withdrawal income is paid at the start of each year while the rest stays invested.
Year-by-year balances
How the two accounts grow while you save. The last column is what the tax-deferred account would be worth if you withdrew it all that year.
Year
Taxable balance
Tax paid that year
Tax-deferred balance
Tax-deferred after tax
Results are estimates for educational purposes and are not financial, tax or legal advice.
How the Taxable vs. Tax-Deferred Investments Calculator Works
The investment growth calculator runs the same savings plan through three account types at once: a fully taxable account, a tax-deferred account and a tax-free account. Everything is identical between the three except when the tax is collected, which is exactly why the results differ. Each field below matches one input of the tool. The free savings taxes and inflation calculator uses the same plain-English approach, so you can compare results side by side.
Annual rate of return
This is the yearly return you expect after fund costs. The rate of return compounds every month in the model, and for the taxable account it is reduced by your tax rate on earnings. A cautious figure of 5% to 7% suits a diversified portfolio, because actual volatility from year to year can be much wider than the average. For context, the S&P 500 has delivered a compounded rate of return near 11% over several decades, but never in a straight line. A higher return widens the gap between the taxable and tax-deferred balances, because tax removes a share of every extra gain.
Years to contribute and years of withdrawals
The years to contribute field sets how long you keep adding money, and years of withdrawals sets how long the balance pays you back. Enter 1 for a lump sum payout instead of a stream of distributions.
Existing balance and new contributions
Your existing balance is what the accounts already hold, and your new contributions are the periodic amount you add. Every principal dollar you add is treated as net contribution money you could have spent, so the three accounts start from the same sacrifice.
Contribution frequency and withdrawal frequency
Choose monthly, quarterly or annual timing for both. The contribution frequency controls how soon each deposit starts compounding, while the withdrawal frequency controls how the payout is sliced.
Tax during contributions and withdrawals
Enter your estimated marginal tax rate for the contribution years and again for the payout years. Look up your filing status in the current federal income tax table to estimate each one, and remember that state levies add to the figure.
Tax deduction
Tick the tax deduction box and the tool assumes tax-deferred contributions are deductible, then raises the deposit so the take-home cost matches the other accounts. That setting is the main reason a tax-deferred plan can beat a tax-free one when you expect a lower bracket in retirement.
Tax-Deferred Account vs. Tax-Free Account: How Each Is Taxed
All three choices answer the same question: when do you hand over the tax liability? The table summarizes the tax treatment of each one. The self employment tax calculator online uses the same plain-English approach, so you can compare results side by side.
Account type
Taxes on contributions
Taxes on growth
Taxes on withdrawals
Taxable account
Paid before you invest
Paid every year
Only on the gains
Tax-deferred account
Often deductible
Postponed
Taxed in full
Tax-free account
Paid before you invest
None
None
Taxable account
A taxable account such as a brokerage account has no shelter. Interest and dividends are taxed in the year they arrive, and capital gains are taxed when you sell, so a slice of the yearly gain leaves before it can compound. That drag is the reason the calculator shows the taxable line trailing the others.
Tax-deferred account
A tax-deferred account postpones the bill. Your deposits can lower taxable income now, the balance grows without yearly tax, and each payout is taxed as ordinary income. A traditional 401(k) is the classic example, and pre-tax deposits reduce your current-year income. Early withdrawals can also trigger penalties.
Tax-free account
A tax-free account, also called tax-exempt, is funded with money you already paid taxes on. In return you owe nothing on qualified payouts, and a Roth account has no required minimum distributions for its original owner. The calculator treats that treatment as the benchmark, since its money never faces a second tax.
Formula: Taxable vs. Tax Deferred vs. Tax Free Growth
The model compounds monthly, so each account’s balance \(B\) after \(n\) months follows one recurrence with a different growth rate \(g\). The taxable account uses a reduced rate because yearly tax removes part of each gain:
The annual balance at the end of the saving years is then paid out as a level stream. The tax-deferred payout is cut by the withdrawal tax rate, while the tax-free payout is not:
$$W = B \times \frac{g}{1 - (1+g)^{-m}} \qquad W_{deferred}^{net} = W \times (1 - t_{w})$$
Here \(r\) is the annual return, \(C\) the periodic deposit, \(t_{c}\) the tax rate during contributions, \(t_{w}\) the rate during withdrawals and \(m\) the number of payouts. A tax-deferred plan comes out ahead of a taxable one whenever \(t_{w}\) is low enough that the one-time bill is smaller than the yearly taxes avoided.
Worked Example: After-Tax Withdrawal From Each Investment
Suppose you start with an existing balance of $18,500 and add $425 a month for 22 years. You expect a 6.8% return, a 24% rate during contributions and a 22% rate in the 18 years of monthly withdrawals. The results:
Investment type
Balance after 22 years
Monthly payout before tax
After-tax withdrawal per month
Total after-tax withdrawals
Taxable investment
$266,617
$1,918
$1,918
$414,386
Tax-deferred investment
$342,071
$2,750
$2,145
$463,282
Tax-free investment
$342,071
$2,750
$2,750
$593,951
Your own total deposits are $112,200 on top of the starting balance in every column. The tax-deferred plan pays $227 more per month than the taxable plan, and the tax-free plan pays $832 more. Turn on the deduction option and the tax-deferred payout rises to $2,659 a month, because larger pre-tax deposits make up for the withdrawal tax.
A 22% withdrawal tax turns the $2,750 pre-tax payout into $2,145 a month.
Why the tax-deferred and tax-free balances match
Both accounts compound at the full 6.8%. The gap appears only at withdrawal, when the tax-deferred payout loses 22% to income tax. If your rate during retirement equals your rate while saving and you can deduct deposits, the two end up even.
How the withdrawal rate changes the winner
Raise the payout tax rate to 37% and the taxable plan’s $1,773 beats the tax-deferred plan’s $1,732 after tax, while lowering it to 12% lifts the tax-deferred payout to $2,420. Rerun the form with your own rates before you commit.
The tax-deferred payout beats the taxable one until the withdrawal rate nears 35%.
Which Tax-Advantaged Accounts Count as Tax-Deferred or Tax-Free
Real accounts map onto the three columns of the calculator. Knowing which is which turns the output into an action.
A traditional IRA, 401(k) or 403(b) is tax-deferred, usually funded with pre-tax pay through an employer plan.
A Roth IRA or Roth 401(k) is tax-free, since contributions go in after tax and qualified earnings come out untaxed.
A health savings account (HSA) can be tax-free for qualified medical expenses, with deductible deposits and untaxed growth.
Annual contribution limits apply to each, and people over 50 can add catch-up contributions. A taxable account has no cap, so it holds whatever you save beyond those limits, and the calculator’s taxable column shows what that overflow is worth after yearly tax on dividends, reinvestment and the gains from common investment vehicles. Check the current limits before you size your new contributions.
Comparing a Taxable, Tax-Deferred and Tax-Free Plan at a 32% Bracket
A 41-year-old engineer with $64,300 already saved has a new $1,150 a month to invest and two choices at work: a traditional 401(k) or a Roth 401(k). Her top federal bracket today is 32%, and she expects to retire in 19 years and draw income for 20 more, probably in the 24% bracket that starts at $105,700 for a single filer. She opens the taxable vs. tax-deferred comparison and enters a 7.1% return, 32% during contributions, 24% during withdrawals, then clicks the calculate button.
See how the Taxable vs. Tax-Deferred Investments Calculator works: change the inputs and the tax-deferred comes out ahead by updates instantly. Enter your own numbers in the calculator above.
The first run leaves the deduction box unticked. The taxable account ends at $590,512 and pays $4,027 a month. The tax-deferred and tax-free accounts both reach $801,732 and pay $6,264 a month before tax, but the tax-deferred one drops to $4,761 after a 24% bill, while the tax-free account keeps all $6,264. On that view the Roth looks $1,503 a month better.
That comparison is unfair to the traditional plan, because she would not deposit the same $1,150 after tax into it. She ticks the deduction box, so deposits are raised to the pre-tax amount that costs her the same take-home pay. The tax-deferred balance climbs to $1,062,875 and the after-tax payout to $6,311 a month, $47 more than the Roth’s $6,264. The 32% deduction now outweighs the 24% bill later.
She also reruns the form with 32% in retirement. The tax-deferred payout falls to $4,260 after tax, well below the Roth, which tells her the choice only wins while her bracket drops. The taxable column, at $4,027 a month, is well behind both. Her decision: send the $1,150 to the traditional 401(k) and revisit the split if a pension or a large rollover could lift her retirement income above the 24% range.
Retirement Planning: Choosing Between Tax-Deferred and Tax-Free Investment
Good retirement planning starts with your current and expected future bracket. If you expect a higher bracket later, the tax-free investment usually wins, because you pay today’s lower rate once. If you expect a lower bracket later, a tax-deferred account usually wins, because the deduction is worth more than the later bill.
Each cell is the after-tax monthly payout for one return and withdrawal-tax pair.
Most people do not need to pick only one, and the calculator is how you test a split: run it once with all deposits in the tax-deferred column, once with all in the tax-free column, and compare the totals to see how much each dollar moved between them is worth. A taxable account adds liquidity because you can reach it without age restrictions. Remember that inflation erodes every payout, that the result carries risk because returns are hypothetical, and that a financial advisor can review the numbers against your full picture.
Use the tax benefits of each account in order: capture any employer match first, then compare the tax-free investment and tax-deferred routes with this tool, and put the rest of your savings in a taxable account. Print the calculator’s report to compare scenarios side by side, then update the figures whenever your tax rates or goals change. A taxable vs. tax-deferred vs. tax-free calculator only estimates, so treat the gap between accounts as a direction rather than a promise. A taxable vs. tax-deferred calculator is just as useful for testing a rate you are unsure about.
Taxable vs. Tax-Deferred Investments Calculator questions
What is the difference between taxable and tax-deferred investments?
In a taxable account you pay tax on interest, dividends and gains as they arise. In a tax-deferred account, such as a traditional IRA or 401(k), growth is untaxed until you withdraw, and then the payout is taxed as ordinary income.
Is tax-deferred or tax-free better?
It depends on your tax rate now compared with later. If you expect a lower bracket in retirement, tax-deferred usually wins. If you expect a higher bracket, a tax-free account such as a Roth usually wins. Use the two tax rate fields to test both.
What does the tax deduction checkbox do?
It assumes tax-deferred contributions are deductible and raises the deposit so the take-home cost matches the taxable and tax-free accounts. Leave it unticked to compare equal deposits instead.
Which tax rate should I enter?
Use your estimated marginal federal rate, plus any state rate, for the contribution years and again for the withdrawal years. Your filing status and taxable income decide the bracket.
Why does the taxable account grow more slowly?
Tax is taken from earnings each year in a taxable account, so a smaller balance compounds. Lower capital gains and dividend rates would narrow the gap shown here.
Does this calculator include fees or inflation?
No. Rates of return are before fund costs, and all dollar amounts are in future dollars. Use a lower return to approximate fees or inflation.
Are the results a guarantee?
No. Returns, tax laws and your income will change, so treat the output as a hypothetical comparison and consult a financial advisor for personal advice.