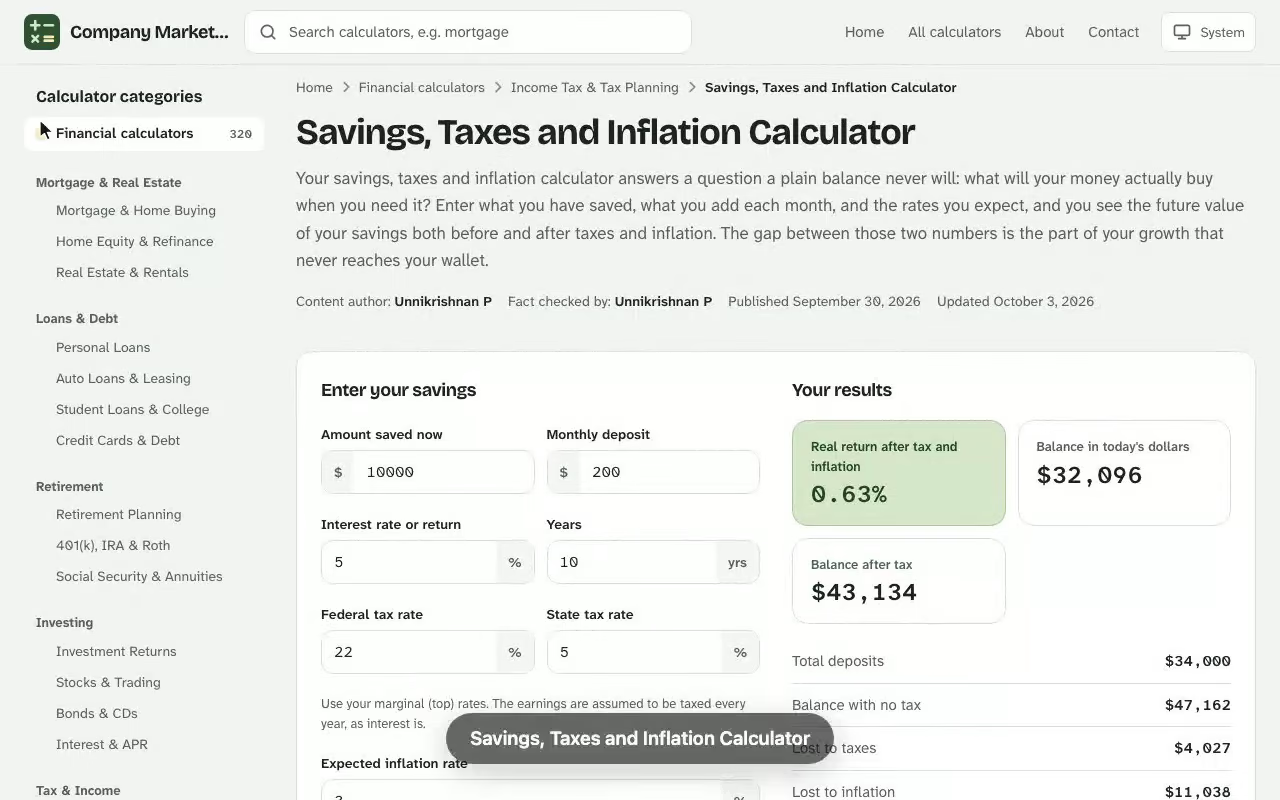
Savings, Taxes and Inflation Calculator. Your savings, taxes and inflation calculator answers a question a plain balance never will: what will your money actually buy when you need it? Enter what you have saved, what you add each month, and the rates you expect, and you see the future value of your savings both before and after taxes and inflation. The gap between those two numbers is the part of your growth that never reaches your wallet. The income tax calculator online is free to use with no sign-up, and works on desktop and mobile.
Your results
Real return after tax and inflation
–
Balance in today's dollars
–
Balance after tax
–
Total deposits–
Balance with no tax–
Lost to taxes–
Lost to inflation–
Return after tax–
Return needed to beat inflation after tax–
Year-by-year: before tax, after tax and after inflation
Each column takes one more cost out of the same savings.
Year
Total deposits
No tax
After tax
After tax, today's dollars
Results are estimates for educational purposes and are not financial, tax or legal advice.
How the Savings, Taxes and Inflation Calculator Works
The calculator grows your starting balance month by month, adds your monthly contributions, and then applies two haircuts. First, taxes are deducted from your earnings each year at the combined federal and state rate you enter. Second, the after-tax balance is divided by an inflation factor so you can see its real value, which is its purchasing power in today's dollars.
Because the results show your future savings with and without taxes and inflation, you get a year-by-year view of the total effects on your investment. That side-by-side picture is what separates a useful savings calculator with tax and inflation from a basic compound-interest widget that only shows a nominal balance.
What the results show
Pre-tax balance: the end balance if no taxes or inflation existed.
After-tax balance: your savings once yearly taxes on earnings are removed.
Inflation-adjusted balance: the after-tax amount expressed in today's buying power.
Total interest earned: growth beyond everything you deposited.
Inputs for a Savings Calculator with Tax and Inflation Estimates
Every field maps to one real-world decision. Gather these numbers before you start, and treat each as an estimate you can rerun. Pair this with the taxable vs tax deferred investments calculator for a fuller picture before you make a decision.
Amount currently invested and monthly contributions
The amount currently invested is your initial deposit, the balance you hold on day one. Monthly contributions are the periodic contributions you add at the beginning of each month. Together they set the principal that growth builds on, and small changes to your monthly contributions usually move the result more than a slightly different return.
Years to invest and annual rate of return
Years to invest is your time horizon. The annual rate of return is the pre-tax growth you expect, which is always a hypothetical figure. Since 1926 the S&P 500 has averaged roughly 10% a year, but a savings account or money market fund earns far less, so match this rate to where your money really sits, whether that is stocks or low-yield savings accounts. A higher rate of return brings higher risk, so use a cautious figure when your savings goals have a firm deadline.
Federal and state income tax rate
Enter your marginal federal income tax rate and your state income tax rate. The marginal rate is the percentage taken from your last dollar of income, not your average. Look at the tax brackets for your filing status, whether single filers, married couples filing jointly, or head of household, to pick the right rung. If you save inside a tax-advantaged account such as a Roth IRA, enter zero for both.
Expected inflation rate
The expected inflation rate is the yearly rise in prices you anticipate. A common yardstick is the consumer price index, and over the past 50 years it has averaged about 4% a year. A lower figure is reasonable for the near term, while a long plan deserves a more cautious one.
The Formulas Behind This Investment Calculator
The math has three steps. Each month the balance receives a contribution and then earns one month of growth at the after-tax rate:
Here \(B\) is the balance, \(C\) is your monthly contribution, \(r\) is the pre-tax annual return, \(t_f\) is the federal rate and \(t_s\) is the state rate. After the final month, the real value comes from dividing by the cumulative price rise:
$$\text{Real value} = \frac{B_{n}}{(1 + i)^{y}}$$
where \(i\) is the inflation rate and \(y\) is the number of years. To see whether you are gaining ground at all, compare the after-tax return with prices:
This approach is a rough estimate. It taxes all growth at ordinary rates and ignores capital gains and qualified dividends, which are often taxed more lightly, so it tends to understate a taxable account that holds stocks.
Worked Example: Savings Calculator Results After 18 Years
Say you start with $27,350, add $425 a month for 18 years, and expect a 5.8% return. Your federal rate is 24%, your state rate is 4.6%, and you expect 3.1% inflation. The combined rate of 28.6% turns 5.8% into an after-tax return of about 4.14%.
Year
Pre-tax balance
After-tax balance
Real value (today's dollars)
1
$34,242
$33,720
$32,706
5
$66,169
$62,006
$53,228
10
$118,011
$104,619
$77,095
15
$187,246
$157,017
$99,327
18
$239,488
$194,067
$112,020
Over 18 years you deposit $119,150: the starting $27,350 plus $91,800 in contributions. Without taxes or inflation, the plan ends at $239,488. Taxes remove $45,421 of that, leaving $194,067. Inflation then removes another $82,047 of buying power, so the real value is $112,020, which is less than the $119,150 you put in. The real return works out to only about 1.0% a year.
How taxes and inflation reduce the 18-year worked example from $239,488 to $112,020.
What the example tells you
A balance that looks like $194,067 can hide a loss in purchasing power. To keep pace with 3.1% inflation under a 28.6% combined tax rate, you need a pre-tax return of at least 4.34%. Any return below that means you lose money in real terms even while the statement grows.
Real value of the example plan under different inflation rates and returns.
How Inflation Shrinks Savings and Your Buying Power
When your savings grow more slowly than prices, inflation shrinks savings without any visible withdrawal. A basket of goods that costs $1,000 today costs about $1,357 after 10 years at 3.1%, so each dollar you saved buys less.
Economists name several causes. Demand-pull inflation appears when buyers want more than sellers can supply. Cost-push inflation follows when production costs jump. The opposite, deflation, means falling prices, while hyperinflation is runaway price growth that wipes out savings entirely. The Federal Reserve aims to hold prices near 2% a year, and the Bureau of Labor Statistics publishes the data behind it. Whichever cause dominates, the calculator captures it through its inflation input, which sets how fast the real-value line falls below the nominal balance.
Key years in the worked example, in today's dollars.
The CPI and the price index
Inflation is measured with the CPI. The price index tracks a representative group of goods and services, and the average inflation rate between two dates comes from comparing the index at each end. When the CPI rises, your cost of living rises with it, which is why a budget built on today's prices drifts out of date.
Testing a 12-Year Tuition Fund with a Savings Calculator
A nurse opens a taxable brokerage account and wants to know whether it can cover a four-year tuition bill that the university's net-price page puts at $105,000 in today's dollars. The account holds $41,830, and $310 goes in each month for 12 years. The nurse expects a 6.4% return, pays 22% federal and 3.9% state tax on earnings, and plans for 2.8% inflation.
After the nurse clicks Calculate, the after-tax return shows as 4.74%, and the end balance reads $134,035. That looks like a comfortable cushion over $105,000. Then the nurse reads the inflation-adjusted line, which shows the same savings worth $96,228 in today's money, $8,772 short of the tuition bill. The savings, taxes and inflation result changes the decision: the headline balance said yes, and the real value says not yet.
The fix is one input. The nurse raises the monthly amount and reruns it:
$310 a month gives a real value of $96,228, which misses the target.
$380 a month gives $147,633 nominal and $105,991 real, which clears the $105,000 mark.
As a last check, the nurse enters zero for both tax rates to mimic a sheltered education account, and the $310 plan reaches $112,888 in real value. So the nurse sets the automatic transfer to $380 now and plans to compare a tax-advantaged option next month.
Taxes on Savings and Investment Growth
Where your money sits changes how much taxes bite. Interest in a taxable account is taxed in the year it is earned. Growth in a tax-deferred account waits until withdrawal, and qualified withdrawals from a Roth are tax-free. Because the calculator assumes yearly taxation, the taxable result is the conservative case.
Typical savings accounts and money market accounts quote an APY, short for annual percentage yield, and most are insured by the FDIC. That safety comes with a low interest rate, so after tax, plain savings accounts at a bank or other financial institution often fail to beat inflation. Enter an account's APY as your annual rate of return, and the after-tax result shows whether it beats inflation. Compounding helps, but only when the after-tax return stays above the inflation rate.
Savings Withdrawal Calculator Planning: Turning Real Value into Spending
Real value is the number to use when you plan withdrawal amounts. A nest egg of $194,067 sounds large, but with the example's real value of $112,020, it supports far less spending in today's terms. For retirement planning, pick a target in today's dollars, then work backward to the contributions needed.
Decide the yearly spending you want in today's money for your retirement years.
Run the calculator and read the inflation-adjusted balance, not the headline balance.
Raise your monthly contributions or extend the years to invest until the real value meets your target.
Review the plan yearly, because rates and your income change.
A financial advisor or a tax advisor can help you choose the tax inputs when a personal savings plan mixes account types, holds retirement accounts, or includes a year with unusual earnings.
Choosing Tax Inputs for the Investment Calculator
Pick the rate that matches your situation, then test a range. Run the plan once with your current rates and once with zero taxes to simulate a sheltered account, and compare the two end balances. The difference is the total interest earned that the tax system claims, and it shows how much an accumulation schedule in a tax-advantaged account could add. Read the result this way: if the after-tax return falls below the inflation input, the real-value line shows your principal losing purchasing power even as growth continues, because prices rise faster than the balance.
Strategies to Protect Savings Against Taxes and Inflation
Once you see the gap between nominal and real growth, a few moves narrow it. None is a guarantee, and each trades safety, access or simplicity for return, so weigh them against your own financial situation and the date you will need the money.
Shelter growth: use a tax-advantaged account for long-term investing, so more of each year's earnings stays invested instead of going to taxes.
Shop for yield: compare high-yield savings accounts, since an extra point of interest rate compounds for years.
Index your contributions: raise your monthly contributions by the inflation rate each year so your real saving rate does not erode.
Test safer assets: lower the annual rate of return to a cash-like figure and rerun to see how much real value you give up for stability.
See how the Savings, Taxes and Inflation Calculator works: change the inputs and the real return after tax and inflation updates instantly. Enter your own numbers in the calculator above.
Treat these as levers you can test in the calculator. Raising contributions by 3% a year, for example, keeps pace with inflation, and lowering the tax inputs mimics a sheltered account. Each change shows up immediately in the real value line, which makes the trade-offs concrete and gives your savings plan a measurable direction. Each rerun uses your own financial inputs, so change the return, the tax rates or the monthly deposit one at a time and watch which one moves the real value most. Revisit them whenever your income, your tax situation or the inflation outlook shifts.
Limits of a Hypothetical Estimate
Every figure here is hypothetical. Real returns vary, tax laws change, and inflation is never constant, so a single run is a guide rather than a promise. Use the result to compare strategies, such as a higher deposit versus a longer horizon, rather than to predict a precise balance. Investing always carries investment risk, and a bank savings product is not the same as a market fund. Rerun the numbers whenever a rate or your plan changes, and put money where its after-tax growth beats inflation in the long run.
Savings, Taxes and Inflation Calculator questions
How do taxes and inflation reduce my savings?
Taxes take a share of your yearly earnings, so your money grows at a lower after-tax rate. Inflation then raises prices, so the same balance buys less. The calculator shows your balance before taxes, after taxes, and as real value in today's dollars so you can see each effect.
Which tax rate should I enter?
Use your marginal rate, the percentage taken from your last dollar of income, for both federal and state tax. Check the tax brackets for your filing status. If you save in a tax-advantaged account such as a Roth IRA, enter 0 for both rates.
What inflation rate should I use?
Pick the average yearly price rise you expect. Long-run consumer price index averages are a common starting point, and many planners test a lower and a higher rate to see how much the result changes.
What is real value?
Real value is your after-tax balance divided by the cumulative price rise over your time horizon. It expresses the future balance in today's purchasing power, so you can compare it directly with what you deposited.
Why is my real value lower than what I deposited?
When your after-tax return is close to or below the inflation rate, your money barely grows in real terms. Contributions made earlier also lose buying power for longer, so the final real value can fall below your total deposits.
How are taxes calculated in this calculator?
Taxes are deducted from your earnings each year at the combined federal and state rate you enter. Capital gains and qualified dividends are often taxed at lower rates, so for stock-heavy accounts this is a conservative estimate.
Does compounding frequency matter?
Yes, but less than your rate or time horizon. More frequent compounding lifts the effective yearly rate slightly, so daily compounding ends a little above annual compounding at the same stated rate.
What does raising contributions with inflation do?
When set to yes, each year's contributions grow by the inflation rate, so the real amount you save stays constant instead of shrinking as prices rise.