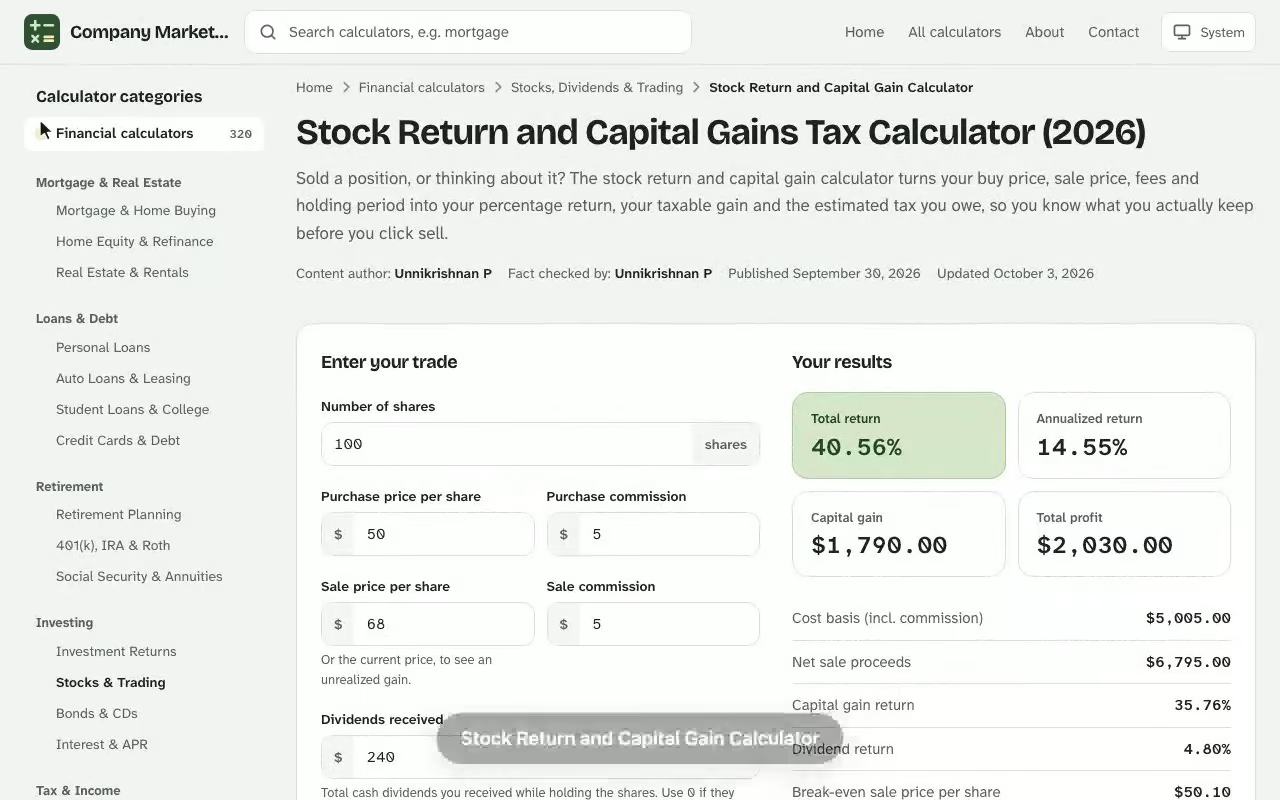
Stock Return and Capital Gain Calculator. Sold a position, or thinking about it? The stock return and capital gain calculator turns your buy price, sale price, fees and holding period into your percentage return, your taxable gain and the estimated tax you owe, so you know what you actually keep before you click sell. Next, open the pivot point calculator and enter your own details to see an estimate in seconds.
Your results
Total return
–
Annualized return
–
Capital gain
–
Total profit
–
Cost basis (incl. commission)–
Net sale proceeds–
Capital gain return–
Dividend return–
Break-even sale price per share–
Holding period–
Gain type–
Estimated tax on the gain–
Profit after tax–
Return after tax–
Results are estimates for educational purposes and are not financial, tax or legal advice.
What the Stock Return and Capital Gain Calculator Measures
A stock sale produces two separate answers, and most investors only look at the first. The first is performance: how much your money grew, in dollars and as a percentage return. The second is the tax bill: the capital gains tax the IRS expects on that profit, which depends on your holding period, taxable income and filing status. A good capital gain calculator reports both side by side, because a 60% return that loses a fifth of its profit to taxes is a different result from one that keeps most of it. The free stock option calculator is free to use with no sign-up, and works on desktop and mobile.
The calculator reads a handful of inputs: the number of shares, the purchase price and sale price per share, any commissions on either side, the days you held the position, and the income details that set your bracket. From those it returns your cost basis, your net proceeds, your gain or loss, your simple and annualized investment returns, and your taxes owed on the sale. Every figure on this page comes from the same formulas, so you can check the arithmetic by hand.
Capital Gain vs. Capital Loss
When you sell for more than your basis, you have a capital gain. When you sell for less, you have a capital loss. A gain is generally taxable and a loss is not, but a loss can still do useful work: it can offset other gains, and if your losses exceed your gains, up to $3,000 a year can reduce your ordinary income, with the rest carried forward to later years. You owe nothing on a stock you still own, because the tax applies only when you realize the profit by selling.
Why Stock Return and Tax Belong in One Calculation
Investors compare funds, stocks and mutual funds on pre-tax return, yet the number that reaches your bank account is the after-tax one. Putting investment returns and tax in one view lets you judge a trade honestly, and it shows how much a different tax year or a longer hold would change the result.
How the Capital Gains Tax Calculator Works
Under the hood, the capital gains tax calculator follows four steps. It builds your basis, finds your net proceeds, subtracts one from the other, and then applies the correct tax rates to the result. The math is plain arithmetic, written out below. Next, open the free stock non constant growth calculator and enter your own details to see an estimate in seconds.
The annualized return then spreads that result across the time you held the stock, so a quick trade and a multi-year hold can be compared fairly: \(\left(\frac{\text{Net proceeds}}{\text{Cost basis}}\right)^{365/\text{days held}} - 1\). Commissions are added to your basis on the way in and subtracted from your proceeds on the way out, which is the treatment the IRS applies to selling costs.
Cost Basis, Proceeds and Capital Gain
Your cost basis is what the position truly cost you, not just the sticker price. It starts with shares times the purchase price and includes the buying commission. Reinvested dividends raise it too, since you already paid tax on them. Net proceeds is what the sale actually delivered after fees. The gap between the two is your gain, and it is the only number the tax rules care about. Mistakes in basis are the most common reason a tax estimate comes out wrong, so keep your trade confirmations handy.
Estimating Taxes Owed on the Gain
Once the gain is known, the calculator sorts it by length of ownership. A stock held for one year or less produces a short-term result taxed at your ordinary income tax rate. A stock held longer produces a long-term result taxed at the lower 0%, 15% or 20% rates. The calculator stacks the gain on top of your taxable income, because your income decides which slice of the gain lands in which tax bracket. The result is an estimate, not a filing, but it uses the same bracket logic your tax return does.
Short-Term vs. Long-Term Capital Gains Tax Rates
The single most valuable fact in this whole topic is the one-year line. Where your holding period falls on either side of it can change the tax rate on the same dollar of profit by 7 to 17 percentage points.
Short-Term Capital Gains Taxed as Ordinary Income
Short-term capital gains come from stocks you held for one year or less. They are added to your income and taxed at your regular rate, which runs from 10% to 37% depending on your bracket. Each additional dollar of short-term capital gain is taxed at your top marginal tax rate, the same as an extra dollar of wages. That is why frequent trading is often less tax-efficient than holding.
Federal tax rate
Taxable income, single filer (2026)
10%
$0 to $12,400
12%
$12,401 to $50,400
22%
$50,401 to $105,700
24%
$105,701 to $201,775
32%
$201,776 to $256,225
35%
$256,226 to $640,600
37%
Over $640,600
Long-Term Capital Gains Rates for the 2026 Tax Year
Long-term capital gains apply to stocks held for more than one year, and the rates are 0%, 15% and 20%. Your ordinary income fills the brackets first, and the gain sits on top. If your taxable income plus the gain stays under the 0% limit, you owe no federal capital gains tax at all. Most investors land in the 15% band. The 20% tax rate applies only at the top.
Filing status
0% rate up to
15% rate up to
20% rate above
Single filer
$49,450
$545,500
$545,500
Married filing jointly
$98,900
$613,700
$613,700
Married filing separately
$49,450
$306,850
$306,850
Head of household
$66,200
$579,600
$579,600
This comparison table of the capital gains calculator's long-term brackets is the reference behind every result on this page. Brackets are adjusted for inflation each tax year, so check the IRS figures for the year you sell.
The example trade passed the one-year line 69 days before the sale, so the gain is long-term.
Worked Example: Capital Gains Tax on a 240-Share Stock Sale
Here is one complete case, run from start to finish. You bought 240 shares on March 11, 2025, at $38.62 per share, paying a $4.95 commission. You sold all 240 shares on May 19, 2026, at $61.87, paying a $6.35 commission. You file as a single filer with $73,400 of taxable income before the sale.
Step
Calculation
Result
Cost basis
(240 × $38.62) + $4.95
$9,273.75
Net proceeds
(240 × $61.87) − $6.35
$14,842.45
Capital gain
$14,842.45 − $9,273.75
$5,568.70
Return
$5,568.70 ÷ $9,273.75
60.05%
Days held
March 11, 2025 to May 19, 2026
434 days
Annualized return
($14,842.45 ÷ $9,273.75)365/434 − 1
48.52%
You held the stock for 434 days, so this is a long-term capital gain. Your $73,400 of income already sits above the $49,450 limit for the 0% rate, so the entire $5,568.70 falls in the 15% band: $835.31 of federal tax. Your effective tax rate on the gain is exactly 15%, and you keep $4,733.39 before any state tax.
From net proceeds to after-tax profit on the 240-share example: the capital gain is $5,568.70 and you keep $4,482.80 after federal and state tax.
What Short-Term Treatment Would Have Cost
Suppose you had sold the same shares in 11 months. The gain would be short-term and taxed as ordinary income. Your $73,400 sits in the 22% bracket (which runs to $105,700), and the added gain stays inside it, so the tax would be $1,225.11 and your after-tax profit $4,343.59. Waiting past the one-year mark saved roughly $390, which is about 4.2% of your original basis. A shorter wait for the same price move would have cost you that much.
The same gain costs $1,225.11 in federal tax if short-term and $835.31 if long-term.
Timing a Stock Sale to Cut Capital Gains Tax by $398
It is October 9, 2026, and an analyst with a single-filer return is looking at 135 shares bought on October 14, 2025, at $72.18 each. The stock now trades at $104.93, and a down payment on a car is waiting for the proceeds. Her $112,300 of taxable income, taken from last year's return less her 401(k) deferrals, sits in the 24% bracket, which runs to $201,775.
She enters 135 shares, $72.18, $104.93, zero commissions at her broker, 360 days held, single filer and $112,300. The calculator reports a cost basis of $9,744.30, proceeds of $14,165.55 and a gain of $4,421.25, a 45.37% return. The holding period is the surprise: 360 days is a short-term result, so the capital gains tax is the ordinary 24% rate, $1,061.10, an after-tax profit of $3,360.15.
The one-year line falls five days away. Because a gain counts as long-term only after more than one year, October 15 is the first eligible sale date. She changes the days held to 366 and the result moves to the 15% long-term rate: $663.19 of tax, a difference of $397.91. The 3.8% net investment income tax does not apply, since her income is far below the $200,000 threshold.
Now the decision. Waiting is not free, because the price can move. Solving for the sale price at which waiting breaks even gives $101.46, so the stock must fall $3.47 per share, or 3.3%, before waiting loses money. She sets a limit order at $101.50 for October 15, and the tax bill, not the market, now sets the calendar for the trade.
Taxes on Stocks: Filing Status and Taxable Income
Two inputs move the tax result more than any other: your filing status and your taxable income. Each filing status has its own 0%, 15% and 20% limits, which is why the same gain can be tax-free for a married couple and taxed for a single filer.
The calculator wants taxable income, not gross income. Taxable income is what remains after you subtract your standard deduction or itemized deductions, along with tax-deductible contributions to a 401(k) or an IRA. Typing in your full salary, as many people do, overstates your bracket and your tax liability. Your annual income figure from a pay stub is the starting point, not the finish.
Single filer: the lowest long-term limits of the main statuses, so the 0% rate fades first.
Married filing jointly: twice the single limits, which makes filing jointly the most tax-friendly status for selling stock.
Head of household: limits between single and joint, for unmarried filers supporting a dependent.
Married filing separately: the same limits as single at the 0% rate, but a much lower ceiling for the 15% rate.
Ordinary Income and the Tax Bracket Stack
Think of your tax bracket as a staircase filled from the bottom. Ordinary income from wages takes the lowest steps first. Your gain then takes the steps above. A long-term gain does not change the rate on your wages, but your wages decide where the gain starts. A gain that straddles a limit is split: the part under the limit gets the lower rate and the part over it gets the higher one.
Net Investment Income Tax and State Capital Gains Taxes
Federal brackets are not the end of the story. Two more layers can apply, and an estimate that ignores them will come in low.
The 3.8% Net Investment Income Tax
The net investment income tax adds 3.8% on the lesser of your net investment income or the amount by which your income exceeds a threshold: $200,000 for single filers, $250,000 for joint filers and $125,000 for married filing separately. With $73,400 of income and a $5,568.70 gain, the example above is nowhere near it, but a larger sale in a high-income year can trigger it.
State Capital Gains Taxes
State taxes on capital gains vary widely: some states charge nothing, some tax gains as ordinary income, and a few add a surcharge for large gains. If your state charged a flat 4.5%, the example would owe another $250.59, leaving $4,482.80 after federal and state tax. That is a 48.34% after-tax return on your $9,273.75 basis.
How to Lower Capital Gains Taxes on Stock Sales
You cannot change the rates, but you can change which rate applies and how much gain is reported. A few practical moves do most of the work.
Hold past one year. It converts a short-term result into a long-term result, as the 434-day example shows.
Harvest losses.Tax-loss harvesting means selling a loser to offset realized gains, and the capital loss can then shelter some of the profit.
Sell in a low-income year. If your taxable income drops, part of the gain may land in the 0% bracket.
Give appreciated shares. Donating stock you've held more than a year avoids the tax on that gain.
Choose tax-efficient holdings. In a taxable account, an ETF that rarely pays distributions may create fewer surprise gains than an actively managed fund.
Tax-Loss Harvesting Basics
Suppose you also hold a stock that fell $2,100 below your basis. Selling it creates a $2,100 loss that cancels against your $5,568.70 gain, bringing the net gain to $3,468.70 and the long-term federal tax to $520.31. That is about $315 less. Mind the wash-sale rule: buying the same security within 30 days before or after the sale disallows the loss.
Free Capital Gains Tax Calculator Inputs Explained
A free capital gains tax calculator can feel like a lot of boxes. Each one does a specific job, and none is decorative.
Purchase price and shares: establish the initial value and, with fees, your basis.
Sale price: sets the sale value and your proceeds.
Length of ownership: decides short-term or long-term treatment.
Filing status and taxable income: pick the correct tax brackets.
State tax rate: adds the state taxes layer.
Leave an optional field at zero when it does not apply. If you sold bonds, an ETF or other capital assets, the same formulas apply, but collectibles and real property follow separate rules, so treat the estimate as a starting point.
Where the Capital Gains Calculator Stops: Real Estate, Funds and Other Assets
The calculator's formulas fit any asset you hold for investment, because basis, proceeds and holding period work the same way for a stock, a fund or a bond. What changes is the special tax treatment around the result, and that changes the tax implications of a sale. Real estate can carry a home-sale exclusion and depreciation recapture, collectibles face a higher maximum rate, and cryptocurrency is treated as property, so the stock-based figure here is only a first pass for those assets. For any one asset of this kind, check the specific rules before you rely on the number.
Funds deserve one extra note: a fund can pass capital gains to you even if you never sold anything, so a year-end distribution can create a bill. Add that gain to your own sales when you enter your figures.
Using Your Stock Return Results to Plan Capital Gains
Why a Capital Gains Tax Rate Calculator Helps Before You Sell
A capital gains tax rate calculator earns its keep before the trade, not after it. Running three or four what-if sales shows you how different sale prices and dates change your gains, so you can decide whether to sell now, wait a few weeks to cross the one-year mark, or sell only part of the position, since each asset lot carries its own basis and its own date. That is real tax planning, and it costs nothing but a few minutes. Investors who test their gains in advance avoid the unpleasant surprise of a larger-than-expected bill when they file.
An investment strategy that ignores tax tends to hand profit back, so run the calculator before you sell, not after. A diversified portfolio gives you a choice of which lot to sell, and the lot you choose changes your basis and your gains. Try a December sale against a January sale to see how a new tax year changes your bracket.
See how the Stock Return and Capital Gain Calculator works: change the inputs and the total return updates instantly. Enter your own numbers in the calculator above.
A quick year-end review of your realized gains, income and remaining losses keeps your money working for you rather than for the IRS, and it protects the money you plan to reinvest in other assets. For a full plan, a financial advisor or tax software can take your whole return into account. Use this calculator to see what each sale is worth after tax.
Stock Return and Capital Gain Calculator questions
How is the capital gain on a stock calculated?
Subtract your cost basis from your net proceeds. Cost basis is shares times purchase price plus buying fees, and net proceeds is shares times sale price minus selling fees. The remainder is your gain, or your loss if it is negative.
What is the difference between short-term and long-term capital gains?
A gain on stock held one year or less is short-term and taxed as ordinary income at 10% to 37%. A gain on stock held more than one year is long-term and taxed at 0%, 15% or 20%, depending on your taxable income and filing status.
How much capital gains tax will I owe on a $10,000 profit?
It depends on your income and holding period. A single filer with $70,000 of taxable income pays about $1,500 on a long-term gain of $10,000 (15%), and about $2,200 if the gain is short-term and taxed in the 22% bracket.
What taxable income should I enter?
Enter your gross annual income. The calculator subtracts your 401(k) and IRA contributions and the larger of the standard deduction or your itemized deductions to find taxable income, so you do not need to work it out first.
Do I owe tax if I sell a stock at a loss?
No. A capital loss is not taxed. It can offset capital gains and, beyond that, up to $3,000 a year of ordinary income, with any remainder carried forward.
What is the net investment income tax?
It is an extra 3.8% on the lesser of your net investment income or the amount your income exceeds $200,000 for single filers, $250,000 for joint filers or $125,000 for married filing separately.
Does the calculator include state taxes?
Yes. Enter your state and local capital gains tax rates as percentages and the calculator adds them to the federal tax. Leave them at zero if your state does not tax gains.
How can I reduce capital gains tax on a stock sale?
Hold past one year, sell losing positions to offset gains, sell in a lower-income year, or donate appreciated shares. Compare the result before and after the one-year mark.