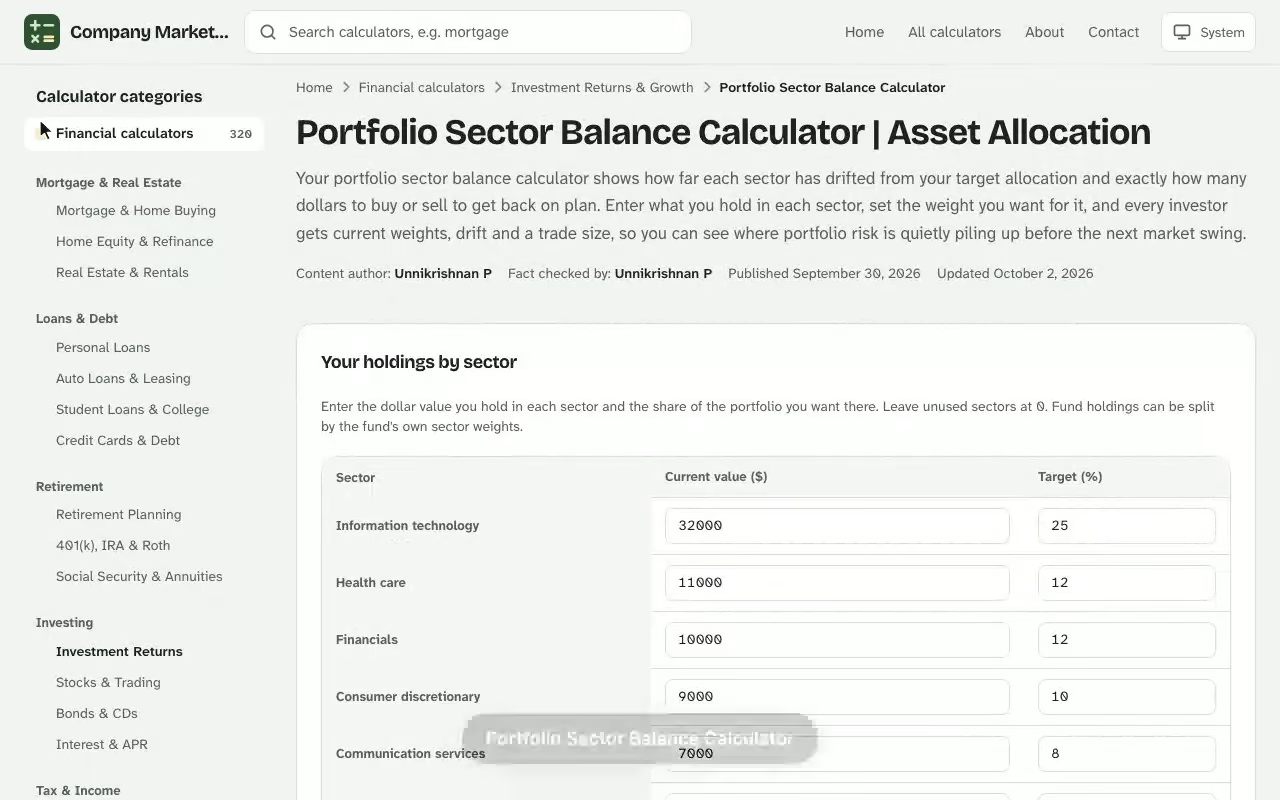
Portfolio Sector Balance Calculator. Your portfolio sector balance calculator shows how far each sector has drifted from your target allocation and exactly how many dollars to buy or sell to get back on plan. Enter what you hold in each sector, set the weight you want for it, and every investor gets current weights, drift and a trade size, so you can see where portfolio risk is quietly piling up before the next market swing. If you want to see how the figures change, the free investment loan calculator gives you an instant result you can adjust as you go.
Balance check and trades
Portfolio off target
–
Total to sell
–
Total to buy
–
Sectors outside the band
–
Portfolio value after trades
–
Most overweight
–
Most underweight
–
Sector
Current
Target
Difference
Status
Trade
Weight after
Results are estimates for educational purposes and are not financial, tax or legal advice.
Portfolio Sector Balance Calculator. Your portfolio sector balance calculator shows how far each sector has drifted from your target allocation and exactly how many dollars to buy or sell to get back on plan. Enter what you hold in each sector, set the weight you want for it, and every investor gets current weights, drift and a trade size, so you can see where portfolio risk is quietly piling up before the next market swing. If you want to see how the figures change, the free investment loan calculator gives you an instant result you can adjust as you go.
What a Portfolio Sector Balance Calculator Measures in Your Portfolio Allocation
A sector is a slice of the stock market grouped by what companies do: technology, health care, financials, energy, consumer staples, utilities and so on. Most investors pick individual stocks, mutual funds or ETFs one at a time, and the sector mix that results is rarely a deliberate choice. A sector balance check turns that accident into a number. It divides the value of each sector by the total, compares the result with the weight you actually want, and reports the gap. The inflation historic impact on investments calculator uses the same plain-English approach, so you can compare results side by side.
Think of it as a focused cousin of an asset allocation calculator. The classic version of asset allocation splits a portfolio across stocks, bonds and cash. This version looks inside the stock sleeve, or across any list of positions you type in, and asks whether one corner has grown too large. Because gains compound unevenly, the best-performing sector quietly takes over: a portfolio that began as an even spread can end up resting on a single industry without you ever placing a trade.
Sectors Versus Asset Classes
An asset class is a broad category of investment, such as equities, fixed income or cash. A sector is a subdivision of one asset class. Both matter. Your asset mix between stocks and bonds sets most of your long-run risk, while your sector mix decides how that stock risk is spread across the economy. The calculator treats both the same way: any row you enter is a position with a value and a target weight.
Current Allocation and Target Allocation
Your current allocation is what the market has made of your money; your target allocation is what you decided it should be. The calculator exists to measure the distance between the two. When the gap on a row is small, you leave it alone. When it is large, you have a concrete dollar figure to act on.
Inputs for the Portfolio Rebalancing Calculator
The form is deliberately short. Each row of the portfolio rebalancing calculator takes three entries, and the totals update as you type. The investment distributions calculator uses the same plain-English approach, so you can compare results side by side.
Asset name – a sector, a fund, an individual holding or even a money-market balance. Use whatever label makes sense to you.
Current value – what that position is worth today in dollars, taken from your brokerage statement.
Target weight – the percentage of the whole you want it to be. All targets must sum to 100%.
Adding an Additional Contribution
If you plan to invest new money, enter it as a line called “Cash” with the amount as its current value. The calculator then spreads the new money across underweight rows, which is the gentlest way to rebalance because nothing has to be sold. An additional contribution works especially well when it arrives with every paycheck.
Positions You Do Not Own Yet
To add a sector you have never held, create a row with a current value of zero and give it a target. The calculator will show how much to buy. This is the quickest way to start broader diversification without disturbing anything else.
Formulas Behind Rebalancing a Portfolio
Every number on the results screen comes from four short formulas. None needs more than a calculator, which is why you can check the tool by hand. Let \(V_i\) be the current value of sector \(i\), \(T\) the total portfolio value and \(w_i^*\) the target weight you chose.
Current Weight and Drift
The current weight is each position divided by the total, and drift is how far that weight sits from target:
A positive drift means the sector is overweight; a negative drift means it is underweight.
Trade Size to Reach the Target
The dollar trade is the target value minus what you hold:
$$\text{Trade}_i = T \times w_i^* - V_i$$
A negative result means sell; a positive one means buy. Because the targets add up to 100%, the buys and sells always cancel out exactly.
The trade formula applied to the technology row: sell $21,840.
New Money Needed Without Selling Anything
When you would rather not sell, only fresh money can dilute the overweight sector. The smallest deposit that brings every sector to target or below is:
The sector with the largest ratio of value to target weight is the bottleneck, and the deposit is sized to it.
Worked Example: A $248,600 Asset Allocation Review
Suppose you hold six sector positions worth $248,600 in total, and you want weights of technology 30%, health care 20%, financials 18%, energy 10%, consumer staples 12% and utilities 10%. Here is what the calculator returns.
Current sector weights in the worked example, with the target weight for each sector listed alongside.
Sector
Current value
Current weight
Target weight
Drift
Trade to reach target
Technology
$96,420
38.79%
30%
+8.79
Sell $21,840
Health care
$47,380
19.06%
20%
-0.94
Buy $2,340
Financials
$41,250
16.59%
18%
-1.41
Buy $3,498
Energy
$22,960
9.24%
10%
-0.76
Buy $1,900
Consumer staples
$24,780
9.97%
12%
-2.03
Buy $5,052
Utilities
$15,810
6.36%
10%
-3.64
Buy $9,050
Total
$248,600
100%
100%
–
$21,840 sold, $21,840 bought
Reading the Drift Column
Technology is the only sector pulling hard: at 38.79% it carries 8.79 points more than planned, so the single largest trade is selling $21,840 of it. Utilities are the most underweight at 6.36% against 10%, which translates to a purchase of $9,050. Health care, financials and energy sit within about 1.5 points of target, so many investors would leave those lines untouched and only trade the big movers.
The sale of $21,840 in technology funds all five purchases in the worked example.
Rebalancing With New Money Instead of Selling
Now imagine you invest an extra $30,000 without selling anything. Technology falls from 38.79% to 34.61% of a $278,600 portfolio, still 4.61 points over target. By the deposit formula you would need $72,800 of new money (since $96,420 ÷ 0.30 = $321,400) before technology reached 30% through buying alone. That gap is useful information: it tells you whether waiting for savings to catch up is realistic or whether a partial sale makes more sense.
Technology reaches its 30% target only after $72,800 of new money, as the deposit formula predicts.
Reading Overweight and Underweight Sectors
Drift is only a signal. What you do with it depends on size, cost and your own plans. A sector that is two points over target in a small portfolio is a rounding error, while two points in a seven-figure account can be a five-figure trade.
How Big a Gap Is Worth Acting On
Many investors use a band of around five percentage points, or a relative band of one quarter of the target weight, before they trade. A 30% target would tolerate drift between 22.5% and 37.5% under the relative rule; the example technology weight of 38.79% breaks that band, while every other row stays inside it.
Why Overweight Positions Raise Risk
A heavy sector means a single industry story, such as a regulation change or a sharp swing in interest rates, can move your whole account. Underweight sectors carry the opposite problem: they leave you with less exposure to the parts of the economy that may recover first. Neither is wrong in isolation, but the aim of a balance check is that you choose the exposure rather than inherit it. In the worked example, the +8.79 drift on technology is exactly the concentration this tool is built to surface.
A Rollover IRA Check With an Asset Allocation Calculator
It is the first week of January and you are reading year-end statements for a rollover IRA worth $197,910. Your written investment policy sets five sector targets and a tolerance band of 5 percentage points around each. Energy has been the best performer all year, so you suspect it has outgrown its slot, but you want the figure before you touch anything.
You type in the five balances: energy $58,430, health care $43,640, technology $39,905, financials $37,215 and real estate $18,720. The targets go in next: 15%, 25%, 30%, 20% and 10%. They sum to 100%, so the table fills in.
Sector
Weight now
Target
Drift
Trade
Energy
29.52%
15%
+14.52
Sell $28,744
Technology
20.16%
30%
-9.84
Buy $19,468
Health care
22.05%
25%
-2.95
Buy $5,838
Financials
18.80%
20%
-1.20
Buy $2,367
Real estate
9.46%
10%
-0.54
Buy $1,071
Two rows break the 5-point band from your policy: energy at 14.52 points over and technology at 9.84 points under. The other three sit inside it, so you leave them alone for now. The sector drift this calculator reports makes the decision plain: energy is nearly double its target share.
Because the money sits in an IRA, selling carries no immediate tax bill. You also check the alternative of fresh money only: it would take roughly $191,623 of new deposits to dilute energy to 15%, which is nearly as much as the whole account, so that route is off the table. Your next action is specific: sell $28,744 of energy, buy $19,468 of technology and the three small top-ups, then re-enter the new balances a week later to confirm every drift figure is under 1 point.
Choosing Your Asset Mix by Investor Profile
The calculator measures drift; it does not decide your target. That choice belongs to your investor profile, which is shaped by your investment goals, your time horizon and your capacity and willingness to take risk.
Investment Goals
Saving for retirement, a home purchase or a child's education each produce a different plan. A goal with a hard deadline favours steady holdings, while a goal decades away can carry more growth. Write the goal down before you type any target weights, because every later decision traces back to it.
Time Horizon
Your time horizon is the number of years before you need the money. Money needed within a few years usually moves toward bonds and cash. Money you will not touch for fifteen years or more can sit mostly in equities, because there is time to recover from a downturn.
Investing for retirement shows how horizon works. An investor in their thirties who is investing for retirement three decades away can ride out a bad year, while a retiree drawing income cannot afford a large loss early on. Long-term investing rewards patience, but only if the weights you hold match the years you have left, and a financial advisor can tailor the target weights to your own timeline.
Risk Tolerance Versus Risk Capacity
These sound alike but measure different things. Risk tolerance is how much loss you can stomach emotionally. Risk capacity is how much loss your finances can absorb, based on income, savings and obligations. Your risk profile should respect the lower of the two: a person with strong nerves but no emergency fund still has low capacity.
Very conservative – focused on preservation of capital, usually with mostly cash and bonds.
Conservative – accepts modest ups and downs for steady growth potential.
Moderate – balances stability and appreciation with a mix of bonds and equities.
Aggressive – pursues capital appreciation, tolerating volatility and market downturns.
Very aggressive – heavily invested in equities with a long horizon and high return expectations.
Asset Allocation by Age
Age is a shortcut for horizon. Younger savers have decades of future income to replace losses, so they can hold more stocks; older savers often shift toward income and stability. Two classic rules of thumb translate this into numbers.
The Rule of 110
Subtract your age from 110 to estimate the percentage to hold in stocks. At 45, that suggests roughly 65% in equities and the remainder in bonds and cash.
The Rule of 120
The rule of 120 uses the same arithmetic with a higher starting number, producing a more aggressive mix: at 45 it suggests about 75% in stocks. Neither rule is advice; both are only a starting point for the target column.
Understanding Each Asset Class in Your Asset Mix
Before you decide on a split, it helps to know what each building block does.
Stocks and Equities
Stocks, also called equities, are ownership shares in companies. You earn money from price gains and from dividends. Many people hold them through mutual funds, index funds and exchange-traded funds, which pool money into a diversified basket. Inside the stock sleeve you can classify holdings several ways:
Large-cap companies – established and typically steadier.
Mid-cap companies – still growing but more settled than smaller peers.
Small-cap companies – higher growth potential and higher risk.
International stocks – companies outside your home country, which broaden diversification.
Emerging markets – faster-growing economies with less predictable results.
A single blue chip name is still one stock; a fund or ETF spreads that exposure across many.
Bonds and Fixed Income
Bonds are loans you make to a government or company. In return you collect interest, set by the coupon rate, until maturity, when the issuer repays your principal. Treasury bonds carry the lowest default risk, corporate bonds pay more for more risk, and municipal bonds often pay interest free of federal tax. As fixed-income holdings, bonds usually move more gently than equities and cushion the ride.
Cash and Cash Equivalents
Cash includes money market funds, certificates of deposit and a high-yield savings account. It provides flexibility and a buffer, but holding too much loses ground to inflation over the long term.
Alternative Investments
Real estate, commodities, hedge funds and private equity are alternative investments. They can diversify a portfolio further, though several are limited to accredited investors, and a basic sector calculator treats them like any other row.
Portfolio Diversification Across Industries
Disciplined investing starts with diversification, the practice of spreading money so one disappointment cannot sink the whole account. Owning twenty stocks in one industry is not diversified; owning a handful across different industries often is. The balance check makes this visible: if three sectors account for nine tenths of the value, the portfolio is concentrated no matter how many tickers appear on the statement.
Diversify across more than sectors, too. Combine stocks with bonds and cash, mix domestic with international holdings, and add different company sizes. Think of it as a seesaw: when one holding sags, another is ideally rising to keep the whole thing level.
Rebalancing Methods: Selling Versus New Contributions
There are two ways to move back toward your target mix, and the calculator supports both.
Selling Overweight Positions and Buying Underweight Ones
You sell the overweight positions and reallocate the proceeds to the underweight ones. This is the fastest route and the one the trade column shows by default. It works best inside a retirement account, where trades usually carry no immediate tax.
Fresh Money Instead of Sales
You leave the large positions alone and direct every new deposit to the underweight rows. It costs less and avoids selling, but it can take months or years, as the deposit formula showed.
How Often to Review Your Portfolio Allocation
Two schedules are common. A calendar approach checks the weights once or twice a year and trades whatever has drifted. A threshold approach acts only when a position leaves its band, no matter the date. Many investors combine them, and some prefer to rebalance only when both signals agree: look at the portfolio every six months, and trade only if a sector has crossed the band. Over-trading adds costs without improving the plan, so more frequent is not better. At each review, re-enter your current balances into the calculator and read the drift column against your chosen band; a row that stays inside it needs no trade, however the last quarter felt.
See how the Portfolio Sector Balance Calculator works: change the inputs and the portfolio off target updates instantly. Enter your own numbers in the calculator above.
Taxes, Costs and Retirement Accounts When You Trade Back to Target
In a taxable brokerage account, selling a winner can trigger a capital gains tax bill that eats into the benefit. Check each position's cost basis before you act, prefer lots held longer than a year, and consider using new contributions first. Tax-loss harvesting can offset some gains, and inside a tax-advantaged IRA or 401(k), you can usually trade freely, so these accounts are often the best place to do the heavy lifting. Remember also to count trading fees and fund expense ratios; a small drift is not worth a costly trade. Your retirement savings and your taxable income both shape which account to touch first, and a financial advisor or tax professional can help you sequence it.
Common Mistakes When Balancing Portfolio Weights
Letting targets drift with the market. Revising targets to match whatever has been winning defeats the point; change them only when your goals or horizon change.
Counting funds as one holding. A broad technology fund and a growth fund can both be mostly the same companies, so look through to the sectors.
Forgetting cash. Idle cash is part of the portfolio and dilutes every other weight.
Targets that do not total 100%. The calculator needs a sum of exactly 100 to produce trades that cancel out.
Investing without a written plan. Judging each investment by recent returns, instead of by its job in your long-term investment plan, is how weights drift unnoticed.
Trading too often. Frequent small trades raise costs and taxes more than they lower risk.
Limits of This Investment Calculator
An investment calculator that checks balance is a snapshot, not a forecast. It does not know your expected return, your annual return or the expected returns of any single fund, the direction of the economy or what interest rates will do next. To look forward, pair it with an investment growth calculator that models compounding, or a portfolio tester that backtests historical returns against a benchmark and runs a Monte Carlo simulation, using standard deviation to simulate a range of outcomes. Each portfolio weight you see here is simply a percentage of today's total, so it says nothing about where prices go next. Historical returns never guarantee future ones, and a short-term fall in the market can change every weight on the screen overnight. Treat the results as education, and consult a qualified financial advisor about your financial situation and financial goals before you trade.
Portfolio Sector Balance Calculator questions
What is portfolio rebalancing?
Portfolio rebalancing is the process of moving your holdings back to the target allocation you chose. Prices change over time, so some assets grow into a larger share than planned while others shrink. Rebalancing sells the overweight assets, buys the underweight ones, or directs new money to the underweight ones.
How do I rebalance without selling anything?
Enter the amount you plan to invest in the additional contribution field. The calculator spreads that new money across the assets that sit below target. If the overweight asset is far above its target, a contribution alone may not be enough and a partial sale is needed.
What do the absolute and relative deviation bands mean?
The absolute deviation flags an asset that is a set number of percentage points away from its target, for example 5 points. The relative deviation flags it when the gap is a set share of the target itself, for example 25% of a 20% target. An asset outside either band is marked Rebalance.
Do my target allocations have to add up to 100%?
Yes. The target allocation column should total exactly 100%, otherwise the buy and sell amounts cannot balance. The results show the sum of your targets so you can spot a mistake quickly.
How do I add an asset I do not own yet?
Type its name, enter a current value of 0 and give it a target allocation. The calculator then shows how much to buy to reach that target.
How often should I rebalance my portfolio?
Many investors review once or twice a year, or whenever an asset moves outside a chosen band. Checking more often adds trading costs and taxes without necessarily improving the result.
Does the right asset allocation change as I get older?
Often yes. A longer time horizon usually supports a larger share of stocks, while nearing a goal such as retirement usually moves a portfolio toward bonds and cash. Your goals and risk tolerance matter more than any single rule of thumb.