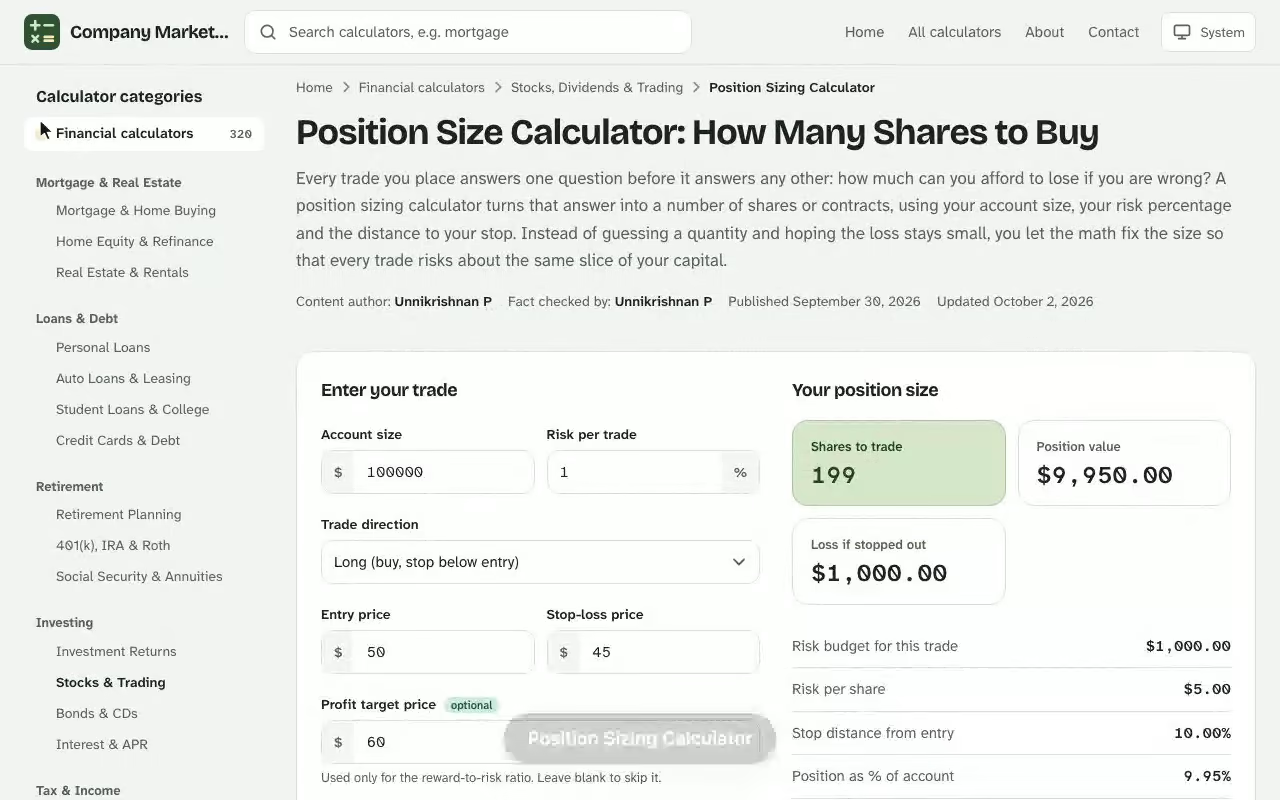
Position Sizing Calculator. Every trade you place answers one question before it answers any other: how much can you afford to lose if you are wrong? A position sizing calculator turns that answer into a number of shares or contracts, using your account size, your risk percentage and the distance to your stop. Instead of guessing a quantity and hoping the loss stays small, you let the math fix the size so that every trade risks about the same slice of your capital. Pair this with the pivot point calculator online for a fuller picture before you make a decision.
Your position size
Shares to trade
–
Position value
–
Loss if stopped out
–
Risk budget for this trade
–
Risk per share
–
Stop distance from entry
–
Position as % of account
–
Actual risk as % of account
–
Reward-to-risk ratio
–
Gain at target, after costs
–
Size limited by
–
Position size at other risk levels
Same entry, stop and limits, with a different share of the account at risk.
Risk per trade
Shares
Position value
% of account
Loss at stop
Results are estimates for educational purposes and are not financial, tax or legal advice.
How a Position Sizing Calculator Works
The idea behind a position size calculator is simple: your stop decides the size, not your conviction. You pick the dollar amount you are willing to lose, measure how far price must travel against you to prove the idea wrong, and divide. The result is the largest position that keeps your loss inside your limit. Traders in stocks, forex, crypto, futures and commodities all run the same logic; only the unit changes. The free holding period return calculator is free to use with no sign-up, and works on desktop and mobile.
The Fixed-Fractional Method
Most calculators use the fixed-fractional approach, where you risk the same percentage of your account on every trade. Because the percentage is fixed, a larger account risks more dollars and a drawdown shrinks them automatically. That built-in feedback is why professional desks lean on it for risk management and capital preservation: your losing trades get smaller exactly when you are performing worst.
Risk Per Trade and Account Balance
Start with your account balance, meaning the money you actually trade with, not your net worth. Multiply it by your risk per trade and you have the dollar risk, sometimes called the risk budget. Some traders prefer a fixed dollar amount instead of a percentage, which works the same way once the amount is entered.
Entry Price, Stop Loss and Risk Per Share
Next, enter your entry price and your stop loss. The gap between them is the risk per share: what a single share, unit or contract loses if the stop is hit. Place the stop-loss price where the trade idea is invalidated, such as beyond support and resistance, rather than at a percentage chosen to make the size look attractive.
The Position Sizing Formula Explained
The position sizing formula has three moving parts and one rounding rule: Pair this with the dividend reinvestment breakeven calculator for a fuller picture before you make a decision.
In words, the dollar risk divided by the risk per share gives the quantity. Then round down to a whole share (or whole contract) so your actual risk never exceeds the risk amount you set. The position value is simply the quantity multiplied by the entry price.
Worked Example: Sizing a Stock Trade
Suppose your account size is $37,400 and you risk 0.75% per trade. You want to buy a stock at $62.80 with a stop at $59.35, and your position size comes out of the math below.
Dollar risk: \(37{,}400 \times 0.0075 = \$280.50\)
Risk per share: \(62.80 - 59.35 = \$3.45\)
Raw size: \(280.50 \div 3.45 = 81.30\), which rounds down to a position size of 81 shares
Position value: \(81 \times 62.80 = \$5{,}086.80\), or 13.6% of the account
Effective risk: \(81 \times 3.45 = \$279.45\), or 0.75% of the account
Notice that the position is worth 13.6% of your account while only 0.75% is at risk. That gap is the whole point: capital exposure and risk are different measures. If you set a take profit at twice the risk, price at $69.70, the target profit on 81 shares is $558.90.
Dollar risk divided by risk per share gives the number of shares to buy; 81.30 rounds down to 81.
What Happens When the Stop Distance Changes
The same $280.50 budget buys very different quantities depending on your stop distance. A tighter stop lets you hold more shares; a wider one forces you smaller. The table shows the same trade at five stop widths, all entered at $62.80.
Stop distance per share
Shares to buy
Position value
% of account
$1.50
187
$11,743.60
31.4%
$2.50
112
$7,033.60
18.8%
$3.45
81
$5,086.80
13.6%
$5.00
56
$3,516.80
9.4%
$7.50
37
$2,323.60
6.2%
The tightest row also shows why a huge quantity is not automatically safe: 187 shares use almost a third of the account, which is where a max exposure cap and your buying power start to matter.
On a fixed $280.50 risk budget, a wider stop distance shrinks the position size.
Position Sizing Across Stocks, Forex, Crypto and Futures
The logic never changes, but the risk per unit is measured differently in each market. Use the table as a quick reference for what to put in the denominator.
Market
Unit sized
Risk per unit
Stocks
Shares
Entry minus stop, in dollars
Forex
Lots
Stop in pips times pip value
Crypto
Coins or units
Entry minus stop, in dollars
Futures
Contracts
Stop in points times point value
Futures Position Size Calculator Math
A futures position size calculator replaces risk per share with stop points multiplied by the point value, which comes from the contract multiplier the exchange sets. A micro Nasdaq-100 contract (MNQ) pays $2 per point. With an $18,500 account, $185 of risk (1%) and a 22-point stop, one contract risks \(22 \times \$2 = \$44\). Then \(185 \div 44 = 4.20\), so the number of contracts is 4 (that stop spans 88 ticks, since one tick on this contract is 0.25 points) and your real loss at the stop is $176. A micro contract makes this granular; the full-size contract would often round down to zero for the same account.
Forex and Crypto: Lot Size and Units
In forex your lot size comes from the pip value. Standard lots, mini lots and micro lots are just multiples of the same unit, so a calculator converts the position size into whichever your broker offers. With $200 of risk and a 25-pip stop worth $10 per pip on one lot, the size is \(200 \div 250 = 0.8\) lots. Coins follow the same formula with a fractional quantity. In crypto, quantity is often fractional, so the number of shares becomes a decimal amount of the coin, and rounding matters far less.
Choosing a Risk Percentage for Position Sizing
Your risk percentage is the single biggest lever on your results. A beginner usually starts at or below 1%, while a professional with a tested edge may go higher in a controlled way. Whatever you choose, write it down before the trading session so the number is not decided by a bad mood in the middle of a trade.
A 0.75% risk per trade falls inside the beginner band of commonly cited risk percentages.
Risk of Ruin and Losing Streaks
The risk of ruin is the probability that a run of losing trades empties your account. Even a 55% win rate produces a losing streak of six or seven in a long enough sample, and consecutive losses at 5% risk compound into a serious drawdown. Run a Monte Carlo simulation on your own results to see the spread of outcomes before raising your risk.
Leverage, Margin and Buying Power
Leverage lets a small deposit control a large position, but it does not change your risk budget. The margin a broker requires only caps the largest size you may open; your stop-loss distance decides the size you should open. Check buying power after the calculation, never before.
Correlation and Portfolio Exposure
Five positions each risking 1% are not 5% risk if they all move together. Correlation inside one sector means your portfolio can behave like a single large trade, so cap the total exposure across related names. Doing this keeps your effective risk honest.
Sizing a $142.65 Entry with a Risk Calculator
A swing trader has a $64,250 account and a standing rule of risking 0.5% per trade, well under the 1% ceiling many risk frameworks cite. A stock has pulled back to $142.65, and the nearest swing low sits at $136.90, so that is where the stop goes. Before touching the order ticket, the trader opens the calculator and enters the account balance, 0.5% risk, the $142.65 entry and the $136.90 stop.
The calculator reports a dollar risk of $321.25 and a risk per share of $5.75. Dividing gives 55.87, which it rounds down to 55 shares. That is a $7,845.75 position, 12.2% of the account, and the real loss at the stop is $316.25, or 0.49%. The position size is the answer to a specific question: how many shares keep a stop at $136.90 inside a $321.25 budget?
The trader then reruns it once with one input changed. A more cautious stop at $134.40, under a round-number level, widens the gap to $8.25 per share and the result falls to 38 shares, a $5,420.70 position. Comparing the two runs shows what the extra room costs: 17 fewer shares for the same dollar risk.
See how the Position Sizing Calculator works: change the inputs and the shares to trade updates instantly. Enter your own numbers in the calculator above.
The $136.90 stop stays, because the $134.40 level sits below where the setup is actually invalidated.
The order goes in as 55 shares with a stop order resting at $136.90.
A target at $154.15, twice the $5.75 risk above entry, would pay $632.50 on 55 shares against the $316.25 at risk.
The decision is mechanical because the number came first. If the stock gaps through $136.90 and fills lower, the loss exceeds $316.25, which is why the trader keeps the quantity at 55 rather than rounding up to 56.
Costs That Change Your Position Size
A calculator shows the ideal trading trade size on paper. Real fills add friction, and each item below pushes your true loss above the planned figure.
Slippage, Commissions and Trading Fees
Slippage happens when a stop fills past its price, and commissions plus trading fees are charged on both entry and exit. A small allowance, such as trimming size by a few percent, keeps the real loss inside your limit. Fast markets and thin stocks need the largest cushion.
Volatility and Average True Range
When volatility rises, a tight stop is hit by noise instead of by a real change in direction. Many traders set the stop as a multiple of the average true range, then let the formula shrink the size to fit: a 2× range of $1.80 sets a $3.60 stop, so \(280.50 \div 3.60\) gives 77 shares instead of 81. The optimal size in a calm market is therefore not the optimal size in a volatile one.
Break-Even and Risk Reward Ratio
Pair the size with a risk reward ratio. A trade targeting twice its risk reaches break-even on the whole system with a win rate near one in three, before fees. Add a risk assessment to each setup: if the reward does not justify the stop distance, skip it.
How to Use a Position Size Calculator Before Every Trade
Treat the risk calculator as a routine trading step: update the stop for today's setup, rerun the numbers, and note the share count and dollar risk in your journal. A disciplined trader does this before every order, because a size that fit yesterday may be wrong today. Recording each result also turns journaling into a clean record you can review, which reduces emotional decisions.
Kelly Criterion and Position Sizing Strategy
The Kelly criterion estimates the percentage that maximizes long-run growth from your win rate and payoff ratio. It is aggressive and sensitive to estimation error, so use a fraction of it as the risk input you enter, not as the size itself: a Kelly estimate of 4%, capped at 1% in the calculator, still lets your stop set the share count. A sensible strategy sets a flat risk first and treats Kelly as an upper bound.
Common Mistakes That Distort Your Result
Moving the stop further away after entry to keep the same quantity, which breaks the math the size was built on
Sizing from account equity that includes unrealized gains you may give back
Skipping the round-down step, so the result lands above your budget
Ignoring the exchange or broker minimum increments, which shift the final quantity
Keep the process boring and repeatable. Using the same steps on every long or short idea, in stocks, options or futures, is what allows a modest edge to survive a bad month. Treat every output as an educational estimate, not trading advice.
Position Sizing Calculator questions
What is a position sizing calculator?
It converts the amount you are willing to lose into a quantity to trade. You enter your account balance, risk per trade, entry price and stop loss, and it returns the number of shares, units, lots or contracts that keeps a stop-out inside that amount.
What percentage of my account should I risk per trade?
Many traders risk 1% or less per trade, and more experienced traders sometimes go to 2-3%. A lower percentage survives a longer losing streak, so beginners usually start small and only raise it after consistent results.
How do I calculate position size by hand?
Multiply your account balance by your risk percentage to get the dollar risk, subtract your stop from your entry to get the risk per share, then divide dollar risk by risk per share and round down to a whole share.
Why does the calculator round down?
Rounding down guarantees your real loss at the stop never exceeds your risk budget. Rounding up would add a little extra risk on every trade, and most platforms do not allow fractional shares or contracts anyway.
How are forex lots and futures contracts sized?
Forex size comes from your stop in pips multiplied by the pip value, shown here as standard, mini and micro lots. Futures size comes from your stop in points multiplied by the contract's point value, so a micro contract fits a small account better than a full-size one.
Does leverage change how many shares or contracts I should trade?
No. Leverage only changes how much margin you need to open the position. Your stop distance and risk budget decide the size; leverage and buying power only cap how large it can be.
Are fees and slippage included in the result?
Yes, when you enter them. Fees on entry and exit and slippage at the stop are added to the risk per unit, so the effective risk shown stays inside your budget instead of quietly exceeding it.
What happens when my stop is very wide?
The same dollar risk buys fewer units as the stop widens, and the calculator can return zero if one unit already risks more than your budget. That is a signal to tighten the stop, accept a smaller position, or skip the setup.