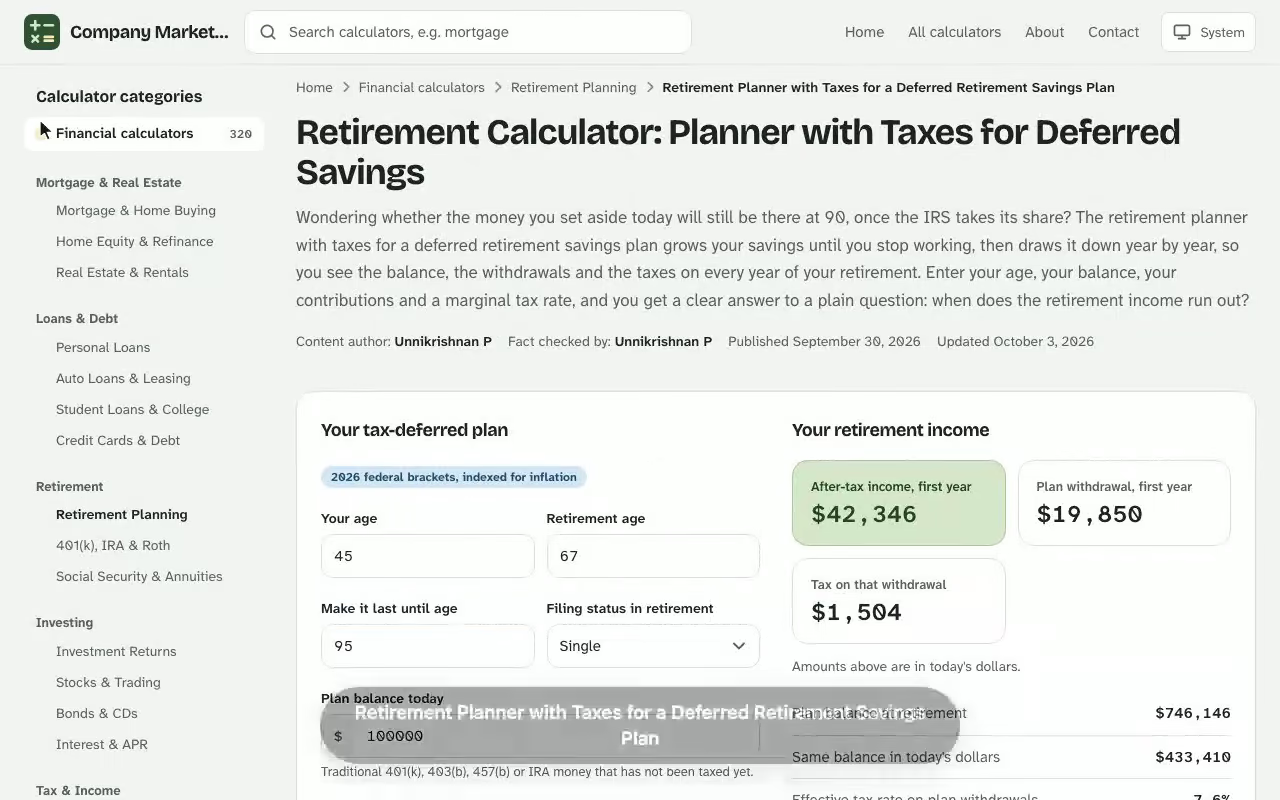
Retirement Planner with Taxes for a Deferred Retirement Savings Plan
Retirement Planner with Taxes for a Deferred Retirement Savings Plan. Wondering whether the money you set aside today will still be there at 90, once the IRS takes its share? The retirement planner with taxes for a deferred retirement savings plan grows your savings until you stop working, then draws it down year by year, so you see the balance, the withdrawals and the taxes on every year of your retirement. Enter your age, your balance, your contributions and a marginal tax rate, and you get a clear answer to a plain question: when does the retirement income run out? Try the life expectancy calculator to run your own numbers — everything is calculated in your browser and nothing you enter is stored or sent anywhere.
Your retirement income
After-tax income, first year
–
Plan withdrawal, first year
–
Tax on that withdrawal
–
Amounts above are in today's dollars.
Plan balance at retirement–
Same balance in today's dollars–
Effective tax rate on plan withdrawals–
Federal bracket in the first year–
Share of final salary replaced after tax–
Total tax on withdrawals, all years (today's $)–
Retirement income and taxes by year
Withdrawals rise with inflation and are sized to use up the plan by your chosen age. Amounts are in future dollars except the last column.
Age
Year
Plan withdrawal
Social Security
Federal tax
State tax
After-tax income
In today's $
Plan balance at year end
Results are estimates for educational purposes and are not financial, tax or legal advice.
Retirement Planner with Taxes for a Deferred Retirement Savings Plan: What It Calculates
This retirement planner with taxes follows one pre-tax account through two stages. In the first stage it adds your yearly contributions and investment growth until your expected retirement age. In the second stage it takes out exactly enough each year to cover your after-tax spending, counts the tax owed on that withdrawal, and lets the remaining balance keep earning. The result is a year-by-year schedule that ends either at the end of your retirement or at the age your savings balance reaches zero. Try the gross distribution calculator to run your own numbers — everything is calculated in your browser and nothing you enter is stored or sent anywhere.
Retirement Savings and Tax Deferral Explained
A deferred plan postpones the tax bill. Money goes in before income tax is applied, so a larger amount compounds for decades, and the bill arrives later, when each dollar leaves the account. That trade is called tax deferral, and it only pays off if you understand how much of every withdrawal belongs to the government. A simple balance projection that ignores this overstates what you can spend, which is why a calculator built around taxes is the more honest picture of your retirement savings.
Pre-Tax Dollars, Ordinary Income and Taxes on Withdrawals
Contributions to a traditional account are made with pre-tax dollars, so every withdrawal is taxed as ordinary income in the year you take it. Those taxes on withdrawals stack on top of any other income, which can push you into a higher tax bracket than you expected. Roth accounts work the other way around: contributions are made after tax, and qualified withdrawals come out tax-free. This tool models the deferred, traditional case, because that is where the tax drag on your retirement balance is largest.
How to Use This Retirement Calculator
You only need a handful of numbers, and a rough estimate is fine. Run it once with your best guesses, then change one input at a time to see which assumption moves your result the most.
Current Age and Expected Retirement Age
Start with your current age, the expected retirement age you are aiming for, and the age through which you want the money to last. Planning to age 90 or 95 is common, because a plan that works only to 80 can fail for a healthy couple. Every extra year of work adds a contribution, adds a year of growth and removes a year of withdrawals, so this field is the strongest lever in the model.
Annual Contribution and Rate of Return
Enter your current savings balance and your annual contribution, plus the percentage by which you expect that contribution to rise each year. Then set the rate of return you expect before retirement and a separate, usually lower, rate for the years after. A conservative mix may earn 4 to 5 percent, a moderately aggressive mix 6 to 7 percent. Choose the rate that matches your real investment style, not the one that makes the chart look best.
Marginal Tax Rate and Inflation
Your marginal tax rate is the rate on the last dollar you withdraw, so use the rate for your expected retirement bracket instead of today's. The rate of inflation raises both your retirement spending and your benefits every year, tracking the cost of living and quietly eroding purchasing power. A 2 to 4 percent assumption is a common planning range, and even the low end halves what a dollar buys over a 25-year stretch.
Social Security, Pension and Other Income
Add the Social Security benefit you expect in a year, a monthly pension if you have one, and any other income such as part-time work or rent. Mark the married option if your spouse is a non-employed spouse who will claim a benefit based on your record. Compare these figures with your monthly spending: every dollar of outside income is a dollar the account does not have to pay, so these entries can change the answer more than the investment return does.
Retirement Planning Formulas Behind the Retirement Income Calculator
Two short equations drive the whole retirement planning model, and seeing them removes the mystery from the results. The first grows your cumulative savings while you work:
$$B_{t+1} = B_t \times (1 + r) + C_t$$
Here \(B_t\) is the balance at the start of year \(t\), \(r\) is the rate of return and \(C_t\) is that year's contribution, which rises by your contribution growth rate. The second finds the gross withdrawal needed to deliver your target after-tax spending:
In this equation \(W\) is the pre-tax withdrawal, \(S\) is the after-tax spending you want that year, \(SS\) is your Social Security benefit and \(\tau\) is your marginal tax rate. The 0.85 reflects the rule that at most 85 percent of a Social Security benefit is taxable. Both \(S\) and \(SS\) are multiplied by \((1 + i)^{n}\) each year, where \(i\) is inflation and \(n\) is the number of years from today, so the figures stay in the dollars of the year they are spent.
Worked Example: A 41-Year-Old Planning to Retire at 66
Take a saver who is 41, wants to retire at 66 and wants the money to last through age 92. These are the inputs and what the planner returns:
Input
Value
Savings balance today
$212,400
Annual contribution (rising 3% a year)
$14,300
Return before / during retirement
6.4% / 4.9%
Inflation
2.7%
Marginal tax rate in retirement
22%
After-tax spending, in today's dollars
$71,500 a year
Social Security, in today's dollars
$29,400 a year
See how the Retirement Planner with Taxes for a Deferred Retirement Savings Plan works: change the inputs and the after-tax income, first year updates instantly. Enter your own numbers in the calculator above.
After 25 years of saving, the account holds $2,104,327. In the first year of retirement, inflation has lifted the $71,500 target to $139,177 and the Social Security benefit to $57,228. The planner therefore withdraws $118,783 from the account and pays $36,834 in tax on that withdrawal plus the taxable share of the benefit. The balance then follows this path:
Age
Gross withdrawal
Balance at year end
66
$118,783
$2,082,836
70
$132,140
$1,949,536
74
$147,000
$1,723,744
78
$163,530
$1,378,712
82
$181,920
$881,242
86
$202,378
$190,226
87
Balance falls short
$0
The planner reports that the money lasts only until age 87, five years short of the goal, even though the balance passed $2 million. Withdrawals of this size grow with inflation, and a larger balance can still be consumed by them.
Reading Your Results: How Long Your Money Will Last
The headline output answers how long your money will last, but the supporting numbers explain why. Look at the projected retirement savings on the day you stop working, then at the first-year withdrawal, then at the tax paid. If the first withdrawal is already a large share of the balance, the plan is fragile no matter how big the balance looks.
Retirement Income Strategy and Withdrawal Rates
A useful sanity check is the first-year withdrawal divided by the balance at retirement. In the example, $118,783 divided by $2,104,327 is about 5.6 percent. Many advisors treat the low 4 percent range as a durable starting point, so 5.6 percent is a warning sign, and the later years confirm it. A sound income strategy compares withdrawal rates across several ages and adjusts the plan before the first check is written, not after the savings needed have already been spent.
Savings Needed Versus Savings Projected
The gap between what you will have and the savings needed to reach your retirement goals is the number to act on. Compare the two, then decide whether to save more, retire later, spend less or accept more investment risk. Each change has a different cost, and the calculator lets you price all four before choosing one.
Testing a Retire-at-63 Plan in the Retirement Income Calculator
Dana, 58, has a pre-tax 401(k) balance of $643,800 and wants to stop working at 63, so the first run uses exactly that. The entries: $19,250 in annual contributions rising 2% a year, returns of 5.8% before and 4.4% after retirement, 2.5% inflation, a 24% marginal tax rate, a target of $64,200 a year after tax in today's dollars, and $24,600 a year in Social Security. Dana is aiming for age 90.
The planner projects a balance of $965,694 at 63. Inflation lifts the spending target to $72,636 in year one, and Social Security covers $27,833 of it, so the account pays out a gross $66,423 and $21,619 goes to tax. That is a 6.9% first-year draw, well above the roughly 4% starting rate planners treat as durable, and the schedule confirms the problem: the account empties at age 79, eleven years short.
The result points at two named facts. Anyone born in 1960 or later reaches full Social Security retirement age at 67, so claiming at 63 already means a permanently reduced benefit, and Medicare does not start until 65, leaving two years of private coverage to buy. Dana changes one input, the retirement age, and reruns the same calculation.
Retirement age
Balance at retirement
First-year withdrawal
Money lasts until
63
$965,694
$66,423
Age 79
65
$1,125,128
$69,786
Age 83
66
$1,212,497
$71,531
Age 86
Even at 66 the money stops four years before 90, so the next rerun keeps the retirement age at 66 and lowers the spending target, the other lever the schedule says matters. Dana now has two concrete decisions to take to a financial advisor instead of one vague worry.
Retirement Savings Calculator Scenarios: Later Retirement and Lower Tax Rates
The most useful habit with any retirement savings calculator is to test hypothetical scenarios against a baseline. Using the same example, here is what two single changes do to the outcome:
Scenario
Balance at retirement
First-year withdrawal
Result at age 92
Baseline: retire at 66, 22% rate
$2,104,327
$118,783
Runs out at 87
Retire at 68 instead
$2,444,996
$125,284
$199,094 left
22% rate replaced by 12%
$2,104,327
$99,757
$309,006 left
Working two more years turns a shortfall into a surplus, because it adds contributions and growth while removing two years of drawdown. A lower tax rate has the same effect through a different route: with the rate at 12 percent, the account hands over far less in taxes and each withdrawal stretches further. Neither change touched the investment return, which shows how much of a retirement outcome is decided by timing and taxes rather than market performance.
Tax Planning for Deferred Plans: Roth, Traditional IRA and 401(k) Accounts
The tax rate you assume is the most uncertain input, and it is partly under your control. Sensible tax planning before retirement can change it.
Traditional IRA, Roth IRA and 401(k) Differences
A traditional IRA and a 401(k) defer tax, which is exactly what this calculator models. A Roth IRA does the opposite, so splitting savings between the two types gives you a tax-free pool to draw from and keeps your taxable withdrawals, and therefore your bracket, lower. An employer retirement plan such as a 401(k) also carries contribution limits that rise with your age, which you should check each year.
Required Minimum Distribution and Roth Conversion
Deferred accounts cannot grow forever. A required minimum distribution forces taxable withdrawals to start in your seventies whether you need the money or not. A Roth conversion in the low-income years between retiring and starting those distributions moves money into a tax-free account at a lower rate. Rerun the planner with a lower tax rate for the early years and a higher one later to see whether a conversion is worth the tax you pay up front.
Medicare and Healthcare Costs
Health spending feeds straight into this planner's spending input. Before you turn 65, coverage is yours to buy, and after that Medicare premiums are deducted from your benefit. Add those healthcare costs to your after-tax spending target, or raise the inflation assumption, and the calculator raises the gross withdrawal and the tax owed on it, so the whole schedule shifts rather than the budget absorbing the cost unnoticed.
Savings Planner, Tax Deferral Evaluator and Other Retirement Calculators
No single tool does everything, and knowing what each one is for helps you read your results correctly. A savings planner ranks your goals and tells you how much to set aside each month. A tax deferral evaluator compares a taxable account with a deferred one over different time horizons and tax rates, answering whether deferral is worth it at all. The planner on this page begins where those end: you already have a deferred account and want to know what it will deliver after tax. Other retirement calculators focus on pieces of the picture, such as claiming age or an annuity payout, and a financial advisor can combine them into one coordinated approach to financial planning.
Investment Style: Conservative to Moderately Aggressive
Your return assumption is really a statement about your portfolio, and investing in a blend of stocks, bonds and mutual funds moves the expected return and the risk together. Your asset allocations should drift toward the safer end as you approach retirement, so enter a lower post-retirement return if you hold more bonds, and diversify so one bad year does not decide the outcome. A more bond-heavy mix lowers the return the planner applies in retirement and shortens how long the balance lasts, which is why this one input deserves honest scrutiny.
Next Steps After You Run the Numbers
Save your baseline result, then change one input at a time.
Test a later retirement age and a lower or higher marginal tax rate.
Check that your first-year withdrawal is a sustainable share of the balance.
Review the plan every year, as your income, accounts and the tax rules change.
Treat the projection as an estimate, not a promise: the returns, inflation and tax rates are assumptions, and the real numbers will differ. The purpose is to find the weak points early, while there is still time to fix them.
Retirement Planner with Taxes for a Deferred Retirement Savings Plan questions
How do taxes change a deferred retirement savings plan?
Contributions to a traditional 401(k) or IRA go in before tax, so each withdrawal is taxed as ordinary income. The planner grosses up every withdrawal so that your spending target is met after tax, which means the account has to pay out more than you spend.
Which marginal tax rate should I enter?
Use the rate you expect on your last dollar of withdrawals in retirement, based on your likely bracket, not today's. Try a lower and a higher rate to see how sensitive the outcome is.
How is Social Security treated?
The benefit is entered in today's dollars, grows with inflation, and the calculator treats 85 percent of it as taxable, the legal maximum. Choosing the married option adds a spousal benefit equal to half of yours.
What rate of return and inflation should I assume?
A conservative mix may earn about 4 to 5 percent and a moderately aggressive one 6 to 7 percent, with a lower rate after retirement. A 2 to 4 percent inflation range is a common planning assumption.
How long should my money last?
Plan to at least age 90 to 95. The result shows the age your balance reaches zero, so you can compare it with your goal and adjust savings, retirement age or spending.
Does the planner model Roth accounts or required minimum distributions?
No. It models one pre-tax account taxed at a single marginal rate. Use it as a baseline, then rerun with a lower early-retirement rate to approximate a Roth conversion strategy.
Is the result a guarantee?
No. Returns, inflation, tax rules and benefits are assumptions, so treat the output as an estimate and review it every year, ideally with a financial advisor.