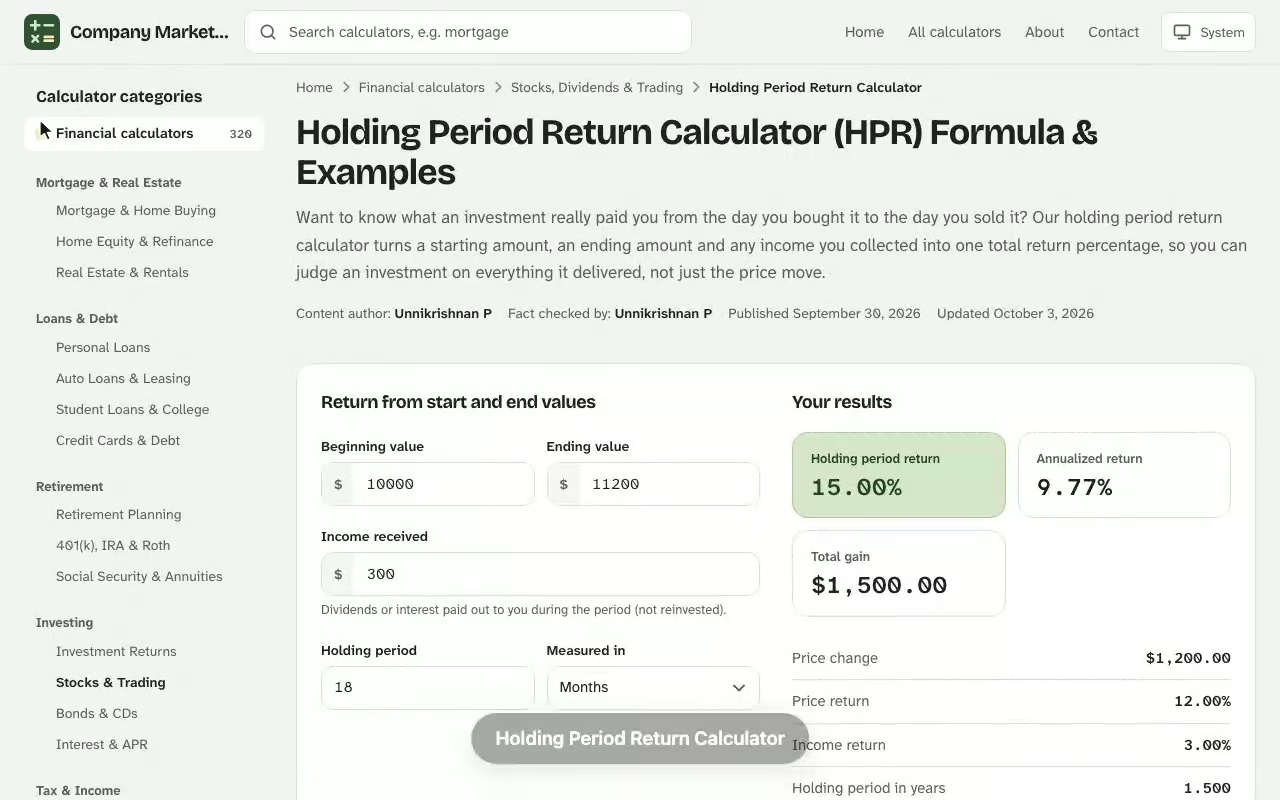
Holding Period Return Calculator. Want to know what an investment really paid you from the day you bought it to the day you sold it? Our holding period return calculator turns a starting amount, an ending amount and any income you collected into one total return percentage, so you can judge an investment on everything it delivered, not just the price move. The free pivot point calculator uses the same plain-English approach, so you can compare results side by side.
Your results
Holding period return
–
Annualized return
–
Total gain
–
Price change–
Price return–
Income return–
Holding period in years–
Linked results
Holding period return
–
Annualized return
–
Ending amount
–
Periods linked–
Average return per period (geometric)–
Simple sum of the returns–
Period
Return
Return to date
Value
Results are estimates for educational purposes and are not financial, tax or legal advice.
Holding Period Return Calculator Formula and Inputs
Holding period return (HPR) measures the complete payoff of owning an asset for a stretch of time. The holding period return formula has three inputs: the beginning value you paid, the ending value you got back or the asset is worth today, and the cash flows you received along the way, such as dividends or interest. Any income received is added to the price change before dividing by what you started with. The stock split calculator online uses the same plain-English approach, so you can compare results side by side.
Written compactly, the HPR formula is:
$$HPR = \frac{(P_1 - P_0) + D}{P_0}$$
Here \(P_0\) is the beginning value, \(P_1\) is the ending value and \(D\) is the income. The gap between \(P_1\) and \(P_0\) is the capital appreciation. A positive result means the investment gained; a loss means you came out behind even after counting every payout.
Capital Gains Yield and Dividend Yield
For a share of stock, the same answer can be built from two pieces. The capital gains yield is the price change divided by the bought price, and the dividend yield is the dividend income per share divided by that same bought price. Add them together and you reach the same holding period return:
This split matters because many people watch only the current price and forget that dividends are a second, separate source of total return.
Input
What to enter
Example
Beginning value
What you paid, meaning the purchase price of every share
$18,400
Ending value
Sale price or current price of the whole position
$21,150
Cash flows
Dividends, interest or other income (optional)
$640
Holding period
Years held, to see the annualized return (optional)
2.5 years
How to Calculate Holding Period Return Step by Step
To calculate holding period return by hand, follow the same sequence the tool runs. Suppose you bought a basket of dividend-paying stock for $18,400, collected $640 in dividends over 2.5 years, and the position is now worth $21,150. The free position sizing calculator is free to use with no sign-up, and works on desktop and mobile.
Capital appreciation: $21,150 − $18,400 = $2,750.
Add the income: $2,750 + $640 = $3,390 of total gain.
Divide by the beginning value: $3,390 ÷ $18,400 = 0.1842, or 18.42%.
The same holding period return calculation through the two yields gives a capital gains yield of 14.95% ($2,750 ÷ $18,400) plus a dividend yield of 3.48% ($640 ÷ $18,400), which again totals 18.42%.
Step
Calculation
Result
Capital gains
$21,150 − $18,400
$2,750
Capital gains yield
$2,750 ÷ $18,400
14.95%
Dividend yield
$640 ÷ $18,400
3.48%
Total
14.95% + 3.48%
18.42%
How the worked example's price gain and dividends add up to its 18.42% holding period return.
Annualized HPR: Comparing Investments Held for Different Lengths
A raw result says nothing about time. An 18.42% gain over 2.5 years is a very different story from 18.42% in six months, so you convert it to an annualized return. Annualizing puts every position on a yearly scale, which makes the comparison apples to apples.
For the example above, \((1 + 0.1842)^{1/2.5} - 1 = 6.998\%\), or roughly 7.00% per year.
Comparing Two Investments by Annualized Holding Period Return
Enter each position's own values into the calculator and the comparison follows. Take a second position: $9,600 grew to $10,020 and paid $310 in income over 1.5 years. Its return is ($10,020 − $9,600 + $310) ÷ $9,600 = 7.60%, which looks far weaker than 18.42%. Yet its annualized figure is 5.01% per year, so the first position still wins, only by a narrower margin than the headline numbers suggest.
Position
Years held
Holding period gain
Annualized return
Dividend basket
2.5
18.42%
7.00%
Second position
1.5
7.60%
5.01%
Annualizing turns 18.42% over 2.5 years into 7.00% a year, and 7.60% over 1.5 years into 5.01%.
Working Out the Total Return on Inherited Shares with an HPR Calculator
Marisol has inherited 240 shares of a regional utility, and her brother wants to buy her out at $52.80 a share. Before she answers, she needs the real figure for what these shares earned, not just the price move.
The records give her a cost basis of $41.35 a share, so the beginning value is $9,924.00. The buyout makes the ending value $12,672.00. Her brokerage statements add up to $3.37 per share in dividends over 4.25 years, which is $808.80 in cash flows. She enters all three, plus 4.25 for the holding period.
The calculator returns a holding period return of 35.84%: the $2,748.00 price gain contributes 27.69%, and the dividends add another 8.15%. Annualized, that is 7.47% a year. Reading only the price, she would have seen a 27.69% gain and underrated the dividends by nearly a third of the total.
Now she benchmarks it: her 7.47% a year trails the S&P 500's long-run average near 10% a year, although a utility's lower volatility partly explains the gap.
Next, she reruns it with her brother's counter-offer in mind, changing only the sale price to $49.00 a share. The result falls to 26.65%, or 5.72% a year, so each $3.80 a share he trims costs her about 1.8 points of annualized return. Her decision is concrete: she will accept $52.80, but not a cent lower.
HPR Across Multiple Periods and the Effect of Compounding
Sometimes you know the yearly or quarterly figures instead of the start and end amounts. The temptation is to add them, but that ignores the effect of compounding, the interest on interest that builds when gains stay invested. Over multiple periods, link each periodic rate by multiplying:
$$HPR = (1 + r_1)(1 + r_2)\cdots(1 + r_n) - 1$$
Take yearly results of 8.6%, −3.1% and 12.4%. Adding them gives 17.9%, but the correct figure is 1.086 × 0.969 × 1.124 − 1 = 18.28%. When every period earns the same rate, the formula shrinks to \((1 + r)^n - 1\), which resembles the annual percentage yield formula and mirrors compound interest. The per-year equivalent of those three results is their geometric mean return, 5.76%.
Reading Your Result: Good, Low or Negative Total Return
Once the tool returns a percentage, compare it with a yardstick. Because the figure covers the whole holding period, the same number can be good or poor depending on time. Useful benchmarks include the long-run S&P 500 average of about 10% a year, current inflation and the yield on a safe bond.
Return range
Reading
Below −20%
Severe loss
−20% to 0%
Loss
0% to 5%
Low, often below inflation
5% to 10%
Moderate
10% to 20%
Good
20% and above
Excellent
Where an 18.42% result falls across the rating bands.See how the Holding Period Return Calculator works: change the inputs and the holding period return updates instantly. Enter your own numbers in the calculator above.
A negative result is entirely possible. If you paid $8,000, the position fell to $7,200 and you collected $150, then ($7,200 − $8,000 + $150) ÷ $8,000 = −8.13%. The dividends softened the loss, which is exactly why the calculation includes them. Run the calculator on a position before selling: if the sale locks in a capital gain or a capital loss, the result after payouts also informs your tax planning.
Who Uses the Holding Period Calculation and Which Assets It Fits
The holding period return works for any asset that pays out while you hold it. For stocks, the income is dividends paid to shareholders. For a bond, it is interest income paid to bondholders. The same arithmetic covers funds, rental properties and other securities in a portfolio, which makes it a practical way to score investment performance across very different holdings.
An investor can also use it to compare strategies, check a gain before selling, or track whether a position beat its benchmark. Both price appreciation and cash payouts count, so a slower-growing stock with a steady payout is not unfairly overlooked when you weigh that investment against a faster-growing one that pays nothing.
HPR vs Other Rate of Return Measures
It is the simplest rate of return, and it is closely related to return on investment and percentage return. It is built for one purchase and one exit. When you add or withdraw money at several dates, switch to the money-weighted return (IRR) or the time-weighted return, which strip out or account for the timing of those flows. For a single buy-and-hold position, this metric plus its annualized form is usually all you need.
Limitations of the Holding Period Return Calculation
Time-blind: a 20% gain is excellent in one year and disappointing in ten, so always pair it with the holding period and the annualized figure.
Ignores risk: it says nothing about volatility along the way for the investment or about diversification.
Single period: several contributions and withdrawals need the modified methods above.
Past results only: it describes what happened, not what comes next.
Use it as one clear lens on total return, then weigh risk, time and goals before deciding what to do with the position.
Holding Period Return Calculator questions
What is holding period return?
Holding period return (HPR) is the total return you earn on an investment over the whole time you hold it. It adds the price change to any income received, such as dividends or interest, and divides by the amount you started with.
How do you calculate holding period return for a stock?
Subtract the bought price from the current price, add the dividend income per share, then divide by the bought price. Equivalently, add the capital gains yield and the dividend yield.
Does holding period return include dividends?
Yes. A complete calculation counts every payout received while you owned the asset. Leaving dividends out understates the real return, especially for high-yield stocks.
What is a good holding period return?
It depends on how long you held the investment. Over one year, 10% to 20% is generally strong, while the same percentage earned over a decade would be weak. Compare against the annualized figure and a benchmark such as the S&P 500.
How is HPR different from annualized return?
HPR is the total gain over the entire holding period. Annualized return converts it to an equivalent yearly rate using (1 + HPR) raised to 1/years, minus 1, so investments held for different lengths can be compared fairly.
Can holding period return be negative?
Yes. If the price falls by more than the income you collected, the result is negative. For example, paying $80, receiving $1.50 in dividends and ending at $72 gives a return of about -8.1%.
When should I not use holding period return?
HPR suits a single purchase and a single exit. If you added or withdrew money at several dates, use a money-weighted or time-weighted return instead.