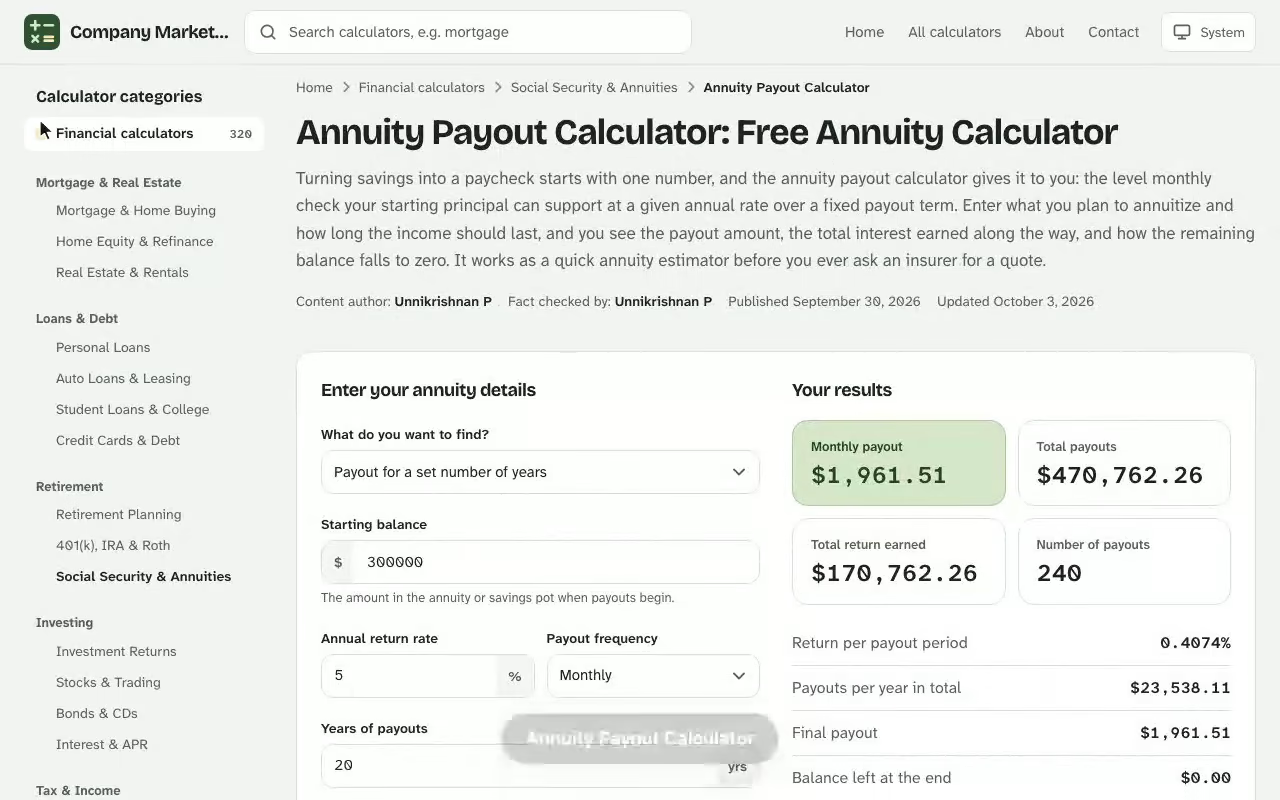
Annuity Payout Calculator. Turning savings into a paycheck starts with one number, and the annuity payout calculator gives it to you: the level monthly check your starting principal can support at a given annual rate over a fixed payout term. Enter what you plan to annuitize and how long the income should last, and you see the payout amount, the total interest earned along the way, and how the remaining balance falls to zero. It works as a quick annuity estimator before you ever ask an insurer for a quote. Pair this with the free annuity calculator for a fuller picture before you make a decision.
Your results
Monthly payout
–
Total payouts
–
Total return earned
–
Number of payouts
–
Return per payout period
–
Payouts per year in total
–
Final payout
–
Balance left at the end
–
Assumes a steady return and level payouts with no fees, taxes or inflation adjustments.
Year-by-year balance
How the balance runs down as you take payouts while the rest keeps earning a return.
Year
Starting balance
Return earned
Payouts
Ending balance
Results are estimates for educational purposes and are not financial, tax or legal advice.
How This Annuity Payout Calculator Estimates Each Payment
The tool applies the standard level-payment formula. It solves for the payment that spends your principal down to exactly zero over the term while the remaining balance keeps earning your rate. In that sense it doubles as an annuity payment calculator: the same math answers what a given principal supports. Because the unpaid balance stays invested, the total of all payments is larger than the principal you started with. The variable annuity without surrender charges calculator is free to use with no sign-up, and works on desktop and mobile.
$$PMT = P \times \frac{r}{1 - (1 + r)^{-n}}$$
In that formula, P is the starting principal, r is the rate per payment period (the annual rate divided by the number of payments per year), and n is the total number of payments. A general annuity calculator grows a balance while you are still saving, whereas this one starts after the saving is done and works only on the spending-down side. Four inputs drive the answer, and each moves the result in a predictable direction.
Starting principal and annual rate
The starting principal is the lump sum you would annuitize, such as a rollover balance or a settlement. The payment scales in direct proportion to it: double the principal and the check doubles. The annual rate is what the unpaid balance earns during the payout phase. A higher rate means more of every check is funded by earnings instead of your own money, so the payment rises, although less dramatically than most people expect.
Payout term and payment frequency
The payout term is the number of years the income should last, and it is the lever you control most directly. A shorter span returns your principal faster, so each check is larger. Payment frequency matters least. On $380,000 at 4.75% over 18 years, one annual check is $31,875.70 and totals $573,762.63, while twelve monthly checks of $2,620.51 total $566,029.42, because monthly withdrawals leave less money invested for less time.
Annuity Payout Calculations: A $380,000 Worked Example
Suppose you move $380,000 into a fixed payout earning 4.75% a year and ask for 18 years of monthly payments. The monthly rate is 0.0475 ÷ 12 = 0.003958, and there are 18 × 12 = 216 payments. Try the variable annuity calculator to run your own numbers — everything is calculated in your browser and nothing you enter is stored or sent anywhere.
Your monthly income is $2,620.51. Across 216 payments you collect $566,029, so $186,029 is total interest earned on the declining balance. The table shows the annual annuity balances at five points along the schedule.
Year
Beginning balance
Interest earned
Ending balance
1
$380,000.00
$17,754.47
$366,308.40
5
$321,114.74
$14,895.72
$304,564.38
10
$229,928.46
$10,468.82
$208,951.20
15
$114,351.62
$4,857.81
$87,763.34
18
$30,651.72
$794.35
$0.00
The balance falls slowly at first and then accelerates. In year 1, 56% of the $31,446 you receive is interest and 44% is your own principal coming back. By year 18 the split flips to 97% principal. That shift is why pulling out the whole balance early gives up so much of the interest the schedule promises.
Interest earned falls from $17,754 in year 1 to $794 in year 18 while the yearly payments stay level at $31,446.The $2,620.51 check times 216 months adds $186,029 of interest to the original $380,000.
Checking the result against a quote
Treat the payment amount as a clean benchmark rather than an offer. An insurance company adds its own costs, so a quote that comes in meaningfully lower for the same principal, rate and term deserves a question about what accounts for the gap. A quote that comes in higher usually means the contract assumes a different rate or shifts risk onto you.
Monthly Payment by Payout Term and Rate
Changing the term reshapes the result more than changing the rate. Holding the same $380,000 at 4.75%, the payments look like this:
Payout term
Monthly payment
Total of payments
Total interest
10 years
$3,984.21
$478,106
$98,106
15 years
$2,955.76
$532,037
$152,037
18 years
$2,620.51
$566,029
$186,029
25 years
$2,166.45
$649,934
$269,934
A longer span lowers each check but raises the interest earned, because the money stays invested longer. Stretching the payout from 10 to 25 years cuts the check by about 46%.
How different interest rates shift the check
At the 18-year term, moving the rate from 3.5% to 6% lifts the check from $2,374 to $2,881, an increase of about 21% for a 2.5-point change. Because interest rates at the moment of purchase are locked in, the same principal can support noticeably different income a year apart. The grid below lets you find your own scenario at a glance.
Monthly payment by annual rate and payout term; the outlined $2,621 cell is the worked example.
Bridging Five Years to Social Security with an Annuity Payment Calculator
Dale retires at 62 with $247,380 in a rollover IRA and a plan to wait until 67, the full retirement age for anyone born in 1960 or later, before claiming Social Security. The household needs $4,300 a month to cover the gap. Dale wants a fixed five-year stream, not a lifetime contract, so this estimate fits.
The entries are straightforward: starting principal $247,380, annual rate 5.15%, term 5 years, monthly frequency. The result reads $4,685.39 a month, with $281,123.11 paid in total and $33,743.11 of it earned interest. That is $385.39 a month more than the gap requires, which tells Dale the full balance is more than the bridge needs.
So Dale changes one input. Working backward from the $4,300 target, a principal of $227,000 produces $4,299.39 a month over the same 60 payments, paying $257,963.24 in all. Annuitizing $227,000 leaves $20,380 outside the contract, which Dale earmarks as a cash reserve, since money inside a payout stream cannot be pulled back out without cost. At 62, Dale is past age 59½, so the 10% early withdrawal penalty is not a concern, but each check is taxed as regular income, and that is the next figure Dale runs by a tax preparer.
The decision: ask three insurers for written quotes on $227,000 for 60 months and accept any quote within about $100 a month of $4,299.39. Anything lower sends Dale back to the calculator to test a 5.15% rate against 4.15%.
Payout Options: Fixed Period, Single Life and Joint Life
This tool models a fixed term over a set number of years, but an annuity contract can pay in several ways. The payout structure you pick decides how long the income lasts and who keeps receiving it.
Period certain (fixed period): payments run for a set number of years, and if the annuitant dies before they end, the remaining guaranteed payments go to a beneficiary.
Life only (single life): payments last as long as the annuitant lives and stop at death. This generally gives the highest check and leaves no death benefit for heirs.
Joint life (joint and survivor): lifetime income for two people, usually spouses, continues until the survivor dies, at a lower amount per check than a single life option.
Systematic withdrawals: you leave the contract unannuitized and take money out on your own schedule, subject to its terms.
Immediate annuity versus deferred annuity
An immediate annuity, often called a single premium immediate annuity or SPIA, starts paying within about a year of the premium. A deferred annuity waits until a future date you choose, so the money earns longer and the insurer expects fewer payout years.
Accumulation phase
The accumulation phase is the stage when you build the contract's value, through one lump sum or a series of deposits. It always comes first, and a buyer close to retirement may keep it very short.
See how the Annuity Payout Calculator works: change the inputs and the money lasts updates instantly. Enter your own numbers in the calculator above.
Annuitization
Annuitization is the switch from building value to receiving income. Once you annuitize, the contract converts the balance into a payment stream that follows the option you chose, and that choice is usually permanent.
What Changes Your Income Annuity Payments
An income annuity from an insurer rarely matches a calculator to the dollar, so it helps to know which forces move the quote.
Interest rate and insurer pricing
The insurer bases its quote on the rate available when you buy, then adjusts for its own costs and profit margin. In a fixed annuity, a minimum guaranteed interest rate sets the floor the contract will credit even if market rates fall. Rising market rates tend to improve a new quote, while an existing stream of payments becomes less valuable to a buyer.
Age, life expectancy and lifetime income
Lifetime income options add a factor this calculator leaves out: your age. Insurers price lifetime income on mortality tables and take on longevity risk, so two people with the same principal can receive very different payments. The older you are when income starts, the higher the check, since fewer payout years are expected. You can approximate a lifetime payout by setting the term near your remaining life expectancy, but only an insurer quote is exact.
Surrender charges and early withdrawal
Many contracts apply surrender charges if you take out more than a free withdrawal amount during the first several years, and these fees usually fade to zero after seven to ten years. Withdrawals before age 59½ can add a 10% federal penalty on top of ordinary income tax, so read the surrender schedule and your planned withdrawal age before committing a large lump sum.
Fixed Annuity Payments, Guarantees and Benefits
A fixed annuity is an insurance contract that credits a stated rate and promises payments the company is obligated to make, which is why people use it to cover essentials. A fixed annuity calculator typically models the growth side, while the payout side is what you are testing here: the guaranteed check a fixed contract promises is the same level payment the formula above produces, before the insurer's costs. The main benefits are predictable guaranteed income, tax-deferred growth and, with the right option, protection for a surviving spouse. The main costs are limited access to your money and a payment that does not rise with inflation unless you buy a rider that makes it do so.
The risk to weigh is that an insurance promise is only as strong as the company behind it, so compare financial strength ratings and check your state's insurance guaranty association limits before you buy.
Taxes on Annuity Income
Earnings in an annuity grow tax-deferred, so tax arrives when the money comes out. How much you owe depends on whether the contract is qualified.
A qualified annuity sits inside an IRA, 401(k) or similar retirement plan funded with pretax dollars, so payments are generally taxed as ordinary income.
A non-qualified annuity is bought with after-tax money. An exclusion ratio splits each payment into a tax-free return of your original investment and taxable earnings.
A 1035 exchange moves one annuity contract into another without triggering tax, which helps when a better contract comes along.
The calculator's gross payment is not a take-home figure, so subtract the tax you expect on the earnings portion and consult a tax professional before relying on it.
Assumptions and Limits of an Annuity Estimator
This estimator reduces a payout to four inputs (starting principal, annual rate, term and frequency) and one formula, and knowing what falls outside them keeps you from over-trusting the result. It assumes each check is the same size, arrives at the end of its period, and is paid from a balance that earns one steady rate. It also ignores fees, the effect of inflation, and tax, so the level payment it reports is a ceiling for a real quote, not a floor. Real insurance products add a margin for the company, may credit a rate that changes after an introductory period, and often round to the nearest dollar.
Inflation and the buying power of a level check
The level payment this estimator reports is a nominal figure, and a $2,620.51 check feels different in year 1 than in year 18. At 3% inflation, the same dollars buy roughly 40% less by the final payment. If rising costs worry you, split the principal between a level stream and a growth investment, or ask whether a cost-of-living rider is available and how much it lowers the starting check.
Step-by-Step: Reading Your Annuity Payout Result
Once you have a result, work through it in this order so the number turns into a decision rather than a guess.
Compare the payment amount with your essential monthly expenses, such as housing, food, utilities and insurance premiums.
Check the total of payments against the starting principal to see how much of the stream is interest.
Rerun the scenario with a shorter and a longer term to see how much income you give up, or gain, for each extra year.
Test a rate one point lower than you expect, since a quote may not match your assumption.
Ask each insurer for a written quote on the same inputs, including any surrender schedule, so the comparison is fair.
If the numbers cover your essentials with room to spare, an annuity may be a sound anchor for your plan. If they fall well short, the answer may be a larger principal, a longer horizon or a different mix of assets, and that is worth learning before you hand over a lump sum you cannot get back.
Using an Annuity Estimate in Retirement Planning
An annuity estimate answers one question: how much retirement income a given principal can produce. Set it beside the other pillars of your retirement plan, such as Social Security and any pension, and use guaranteed payments for essential expenses while growth investments handle the rest.
If you already receive payments and wonder what they are worth as a lump sum, that is a different calculation with different inputs, and an annuity owner should compare several offers. Before you sign anything, run your own numbers, then take both the estimate and the contract to a financial advisor. If you owe a spouse a survivor benefit, price the joint option too, because the cheapest check today may not suit your long-term savings goals or your beneficiary.
Annuity Payout Calculator questions
How is an annuity payout calculated?
For a fixed term, the payment equals the principal times the periodic rate divided by one minus (1 plus the rate) raised to the negative number of payments. The balance keeps earning the rate while payments go out, so the total paid exceeds the principal.
How much does a $100,000 annuity pay per month?
It depends on the rate and term. Use the calculator to test your own inputs: a longer term lowers each payment, and a higher rate raises it. Lifetime annuities are priced by insurers on age and life expectancy, so their payments differ.
Does this calculator work for lifetime annuity payouts?
No. It models payments over a fixed number of years. A lifetime payout depends on your age, life expectancy and the insurer's pricing, so you need a written quote for exact lifetime figures.
What does payout frequency change?
It sets how many checks you receive each year. Annual, semiannual, quarterly, monthly, semimonthly and biweekly schedules all exhaust the principal over the same term, but more frequent withdrawals leave slightly less invested, so the total of payments differs a little.
Is annuity income taxable?
Usually part of it. For a non-qualified annuity, each payment splits into a tax-free return of your original investment and taxable earnings. Annuities held in retirement accounts are generally taxed as ordinary income when paid out. Ask a tax professional about your case.
Why might an insurer quote less than the calculator shows?
Insurers add costs and margins and may credit a lower rate than the one you entered. If a quote is meaningfully lower for the same principal, rate and term, ask what accounts for the difference.
What is the difference between an immediate and a deferred annuity?
An immediate annuity starts paying within about a year of purchase. A deferred annuity waits until a later date, which gives the money longer to earn and usually raises the eventual payment.