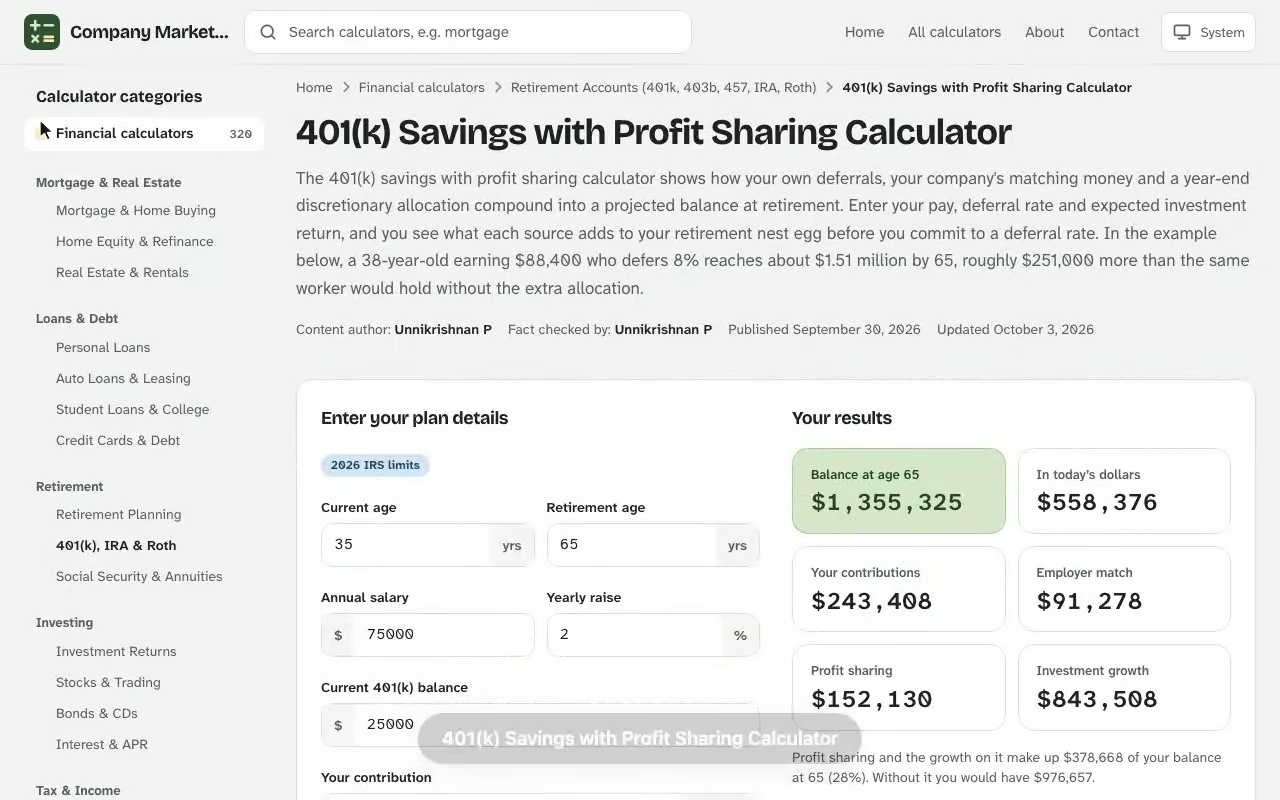
401(k) Savings with Profit Sharing Calculator. The 401(k) savings with profit sharing calculator shows how your own deferrals, your company's matching money and a year-end discretionary allocation compound into a projected balance at retirement. Enter your pay, deferral rate and expected investment return, and you see what each source adds to your retirement nest egg before you commit to a deferral rate. In the example below, a 38-year-old earning $88,400 who defers 8% reaches about $1.51 million by 65, roughly $251,000 more than the same worker would hold without the extra allocation. The free 401k calculator is free to use with no sign-up, and works on desktop and mobile.
Your results
Balance at retirement
–
In today’s dollars
–
Your contributions
–
Employer match
–
Profit sharing
–
Investment growth
–
First year against the 2026 total limit
Your deferrals (excluding catch-up)–
Catch-up contributions–
Employer match–
Profit sharing–
Counted toward the $72,000 limit–
Room left for more profit sharing–
Year-by-year projection
What goes in from you, from the match and from profit sharing each year, and the balance at year end.
Age
Salary
You
Match
Profit sharing
Balance
Results are estimates for educational purposes and are not financial, tax or legal advice.
How the 401(k) Savings with Profit Sharing Calculator Works
A 401(k) is a defined contribution plan: what you end up with depends on the dollars that go in and the growth they earn, not on a promised pension formula. Each year the calculator takes last year's total, grows it by your assumed return, then adds three streams of new money – your payroll deferral, the amount your company pays on that deferral, and the discretionary allocation the plan makes at year end. Then it raises your pay by the annual raise you entered and repeats until the year you stop working. Pair this with the 401k paycheck calculator online for a fuller picture before you make a decision.
That loop collapses into one line for any single year, where \(B\) is the plan total, \(r\) the return, \(S\) your pay, \(d\) your deferral rate, \(m\) the matched portion and \(p\) the allocation rate:
Contributions are assumed to land at the end of each year, which is slightly conservative compared with money that arrives every pay period. Think of this 401(k) calculator as a planning tool for comparing choices, not a forecast of what markets will do.
See how the 401(k) Savings with Profit Sharing Calculator works: change the inputs and the balance at age 80 updates instantly. Enter your own numbers in the calculator above.
Pay, Contribution Percentage and Investment Return
Four inputs drive almost everything, so spend your time getting these realistic:
Current plan total: what your plan statement shows today, including money you rolled in from an old job.
Gross annual pay: the wages your plan counts, before any deduction, because the company's payment and the allocation are both percentages of this number.
Contribution percentage: the share of each paycheck an employee defers. A new employee often starts at 6% and raises it later.
Expected return: a long-run average after fees. Stock-heavy mixes have historically earned more than bond-heavy ones, with far bumpier years along the way.
Optional inputs such as your retirement date, expected pay raises and the discretionary allocation rate fine-tune the projection. Leave the allocation at 0% if your company has never made one.
Employer Contributions in the Formula
The employer match is usually stated as a percentage of your deferral up to a cap, such as 100% of the first 4% of pay. The cap is why deferring less than 4% leaves free money behind. A dollar-for-dollar arrangement is simply a 100% rate. Other employer contributions, like the year-end allocation, do not depend on what you defer at all, which is exactly what makes them so valuable to a newer saver who cannot afford a high deferral yet.
Worked Example: Retirement Savings Over 27 Years
Here is one complete case, with every input shown so you can reproduce it. The worker is 38, plans to stop at 65 and already has $41,250 in the plan. Next, open the free 457 plan paycheck calculator and enter your own details to see an estimate in seconds.
Input
Value
Role in the projection
Current age
38
Starts the 27-year clock
Retirement age
65
Ends the projection
Starting pay
$88,400
Base for every percentage
Salary increase
2.5% a year
Grows pay each year
Your deferral
8% of pay
Your own contributions
Employer match
100% of the first 4%
Company money tied to your deferral
Profit sharing
3% of pay
Year-end allocation, no deferral needed
Annual return
7% a year
Growth applied to everything
In year one your pay is $88,400, so you defer $7,072 (8%), the company matches $3,536 (4%) and the plan allocates $2,652 (3%). The opening $41,250 grows to $44,138, and the new money brings the total to $57,398 after twelve months. Repeating the same step for 27 years gives the milestones below.
End of year at age
Annual pay
Your deferral
Company deposit
Profit sharing
Plan value
39
$88,400
$7,072
$3,536
$2,652
$57,398
45
$102,517
$8,201
$4,101
$3,076
$189,143
50
$115,988
$9,279
$4,640
$3,480
$360,255
55
$131,230
$10,498
$5,249
$3,937
$612,728
60
$148,475
$11,878
$5,939
$4,454
$980,956
65
$167,986
$13,439
$6,719
$5,040
$1,513,390
Where the $1.51 Million Comes From
Over 27 years you personally put in $268,114. Your company adds $134,057 in matching dollars and $100,543 in year-end allocations, and the starting amount contributes $41,250. Together that is $543,964 of actual deposits. The other $969,426 is market gains, which is why the early years matter so much: the first dollars have the longest time to compound.
Each source compounds separately: the 3% profit sharing layer grows to $251,414 on $100,543 of deposits.
Now remove the allocation and rerun the loop. The ending figure falls to $1,261,976. The $100,543 of allocations therefore turned into $251,414 by 65, about two and a half times what was deposited. Each extra point of allocation is worth about $83,800 at the end, as the comparison shows.
Deposits of $543,964 become $1,513,390 because $969,426 comes from compounding.
Allocation rate
Value at 65
Difference from 0%
0%
$1,261,976
–
2%
$1,429,585
+$167,609
3%
$1,513,390
+$251,414
4%
$1,597,194
+$335,218
5%
$1,680,999
+$419,023
The outlined cell is the worked example: a 3% allocation at a 7% return gives $1,513,390.
Profit Sharing Plan Rules That Change Your Result
A profit sharing plan sits inside the 401(k) and lets the company decide each year whether to contribute, and how much. Nothing is guaranteed, so treat the allocation input as a scenario rather than a promise. A 401(k) with profit sharing is common in smaller firms and professional practices, and many a small business retirement plan uses it to reward staff without raising wages.
Allocation Formulas and Counted Pay
The simplest formula divides the pool in proportion to compensation, so everyone receives the same percentage of pay, which is what this calculator assumes. Some plans use new comparability formulas that tilt more dollars toward older workers. Counted compensation normally means W-2 wages, and the plan document sets which bonuses count. If you are unsure, ask your plan administrators for last year's allocation percentage and use that as your starting estimate.
Vesting Schedules for Company Money
Your own deferrals always belong to you. Company money may not. Under a four-year vesting period with graded vesting, you own 25% after one year, 50% after two, 75% after three and everything after four. Under a cliff schedule, you forfeit all of it if you leave before the date. If a job change is likely, lower the allocation in the calculator by the unvested share.
Testing a Higher Deferral with the 401(k) Calculator
Marisol is 47, runs the front office at a veterinary clinic and has a plan statement showing $128,640. Her pay is $71,820, she defers 7%, the clinic matches 50% of the first 6%, and last March the owner posted a 4% year-end allocation. She wants to know whether moving to 10% is worth the smaller paycheck, so she opens the calculator and enters age 47, retirement at 67, a 3.1% raise, a 6.2% return and her current figures.
The first run, with her current 7% deferral, returns $911,322 at 67. Dropping the allocation to 0% to see the downside, in case the owner skips a year, gives $773,349, so the discretionary money is worth $137,973 of the total. That is the number she wants to protect rather than count on.
Next she changes only the deferral to 10%. The projection rises to $1,014,801, an extra $103,480. Year one costs her about $2,155 before income tax, since 3% of $71,820 is $2,155, and because the deferral is pre-tax her take-home pay falls by less than that. Her next step is specific: she asks payroll to start the 10% rate on the first pay period of next month rather than waiting for open enrollment.
She also checks the result against the 4% withdrawal rule of thumb. At $1,014,801, 4% is $40,592 a year, compared with $36,453 at her current rate. Her deferral of roughly $7,200 is still far below the $24,500 limit for 2026, so she has room to raise it again after the next review.
Contribution Limit and Annual Limit Rules in a 401k Calculator
The IRS caps what can go in each year. For 2026, the employee contribution limit is $24,500, rising to $32,500 from 50 and $35,750 for ages 60 to 63. A separate, higher annual limit of $72,000 (or 100% of pay, if lower) covers your deferral, the match and the allocation combined. In the worked example, the final-year total is $25,198, far below that ceiling.
Matching Contributions Within the Yearly Cap
If you front-load your deferral early in the year and hit the cap in autumn, some plans stop matching contributions for the remaining months. Divide the cap by your pay to find a safe percentage, or ask whether your plan offers a true-up at year end.
Tax-Deferred Accounts and Taxable Income
Traditional deferrals are pre-tax, so each dollar lowers your taxable income now. Because the account is tax-deferred, dividends and gains compound without yearly bills, a benefit sometimes called tax deferment. Contributions are tax-deductible in effect, but withdrawals are taxed as ordinary income. Retirees are often in lower tax brackets, which makes the trade attractive, yet that is a guess, not a rule. Roth deferrals flip the order: you pay up front and enjoy tax-free qualified withdrawals. A tax advisor can model which suits your bracket. Either way, the projected total is a gross figure, so withdrawals will be taxed and your spendable income will be lower than the headline number.
Retirement Savings Plan Choices That Affect Your 401(k) Projection
A 401(k) rarely stands alone. A complete retirement savings plan may also include an IRA, a Roth 401(k), Social Security and, for the self-employed, a solo 401(k) where you act as both employee and company.
Roth 401(k) Versus Traditional Deferrals
A Roth 401(k)s take after-tax dollars, so your contributions and earnings can come out tax-free once you reach 59½ and the account has been open five years. The IRS applies one shared limit to both types, so an employee can split a deferral between them but cannot exceed the single cap. Many plan participants choose Roth when they expect a higher bracket later and traditional when they want the deduction now. The calculator treats both identically before tax, so compare the after-tax results separately.
If your employer-sponsored plan makes employees wait six months before they are eligible, enter only the years you will actually contribute, so the projection does not overstate the result.
Rollover to an IRA When You Change Jobs
When you leave, you can keep the money where it is, move it into the next company's plan, or complete a rollover into an IRA. A direct transfer triggers no tax. An IRA usually offers broader choices, though you lose some protections and any plan with unusually low fees. Compare costs before moving. Money you roll in simply raises the current plan total you enter in the calculator.
Early Withdrawal, Penalty and Required Minimum Distribution
Taking money out before 59½ usually brings income tax plus a 10% penalty, so an early withdrawal from a $1 million account would destroy decades of compounding. At the other end, the required minimum distribution forces withdrawals to begin at 73 and is based on the prior December 31 value and life expectancy tables. Missing it costs a 50% excise charge on the shortfall. The calculator assumes no withdrawals before retirement, so a mid-career cash-out would make its projected balance far too high.
Investment Choices Inside the Plan
Most plans offer index funds, mutual funds and target retirement funds that shift from stocks toward bonds as the date nears. Bonds pay interest, stocks pay dividends and gains, and cash pays little after inflation. Choose the mix first, then enter the return it can reasonably earn after fees and inflation. Using 7% for a stock-heavy mix and 4% to 5% for a cautious one is a sensible pair to compare. Remember that a higher assumed return usually means a wider range of outcomes, so test a pessimistic case before you settle on a deferral rate that depends on the optimistic one. The return you choose feeds every figure the calculator returns, including the allocation-rate comparison above.
Reading Your Results with a Retirement Calculator
Use this retirement calculator to run three versions: your current plan, a higher deferral and a no-allocation case. If the gap between the first and last is large, you depend on the company's generosity and should save more yourself. Pair the output with other retirement calculators, such as an income estimator, to turn a balance into a monthly paycheck. Revisit the numbers each year, because pay, returns and plan rules change.
Raise your deferral by one percentage point each time your pay rises.
Confirm that you capture the full company payment before you chase higher returns.
Check your statement each year and update the starting value.
401(k) Savings with Profit Sharing Calculator questions
What is a 401(k) with profit sharing?
It is a 401(k) plan that lets your employer add a discretionary contribution, usually a percentage of pay, on top of your own deferrals and any regular match. The employer decides each year whether to contribute and how much.
How is profit sharing different from an employer match?
A match depends on what you contribute, for example 50% of your contribution up to 6% of pay. A profit sharing contribution does not depend on your deferral and is set by the employer, so you can receive it even if you contribute nothing.
How much can I contribute to a 401(k) in 2026?
The employee deferral limit is $24,500 for 2026, $32,500 if you are 50 or older and $35,750 for ages 60 to 63. Total contributions from you and your employer are limited to $72,000 or 100% of pay, whichever is lower.
What return should I assume?
Use a long-run average after fees that fits your investment mix. Many people test 5%, 6% and 7% to see the range, because a stock-heavy portfolio can earn more but with larger swings.
Is profit sharing money always mine?
Not always. Your own deferrals are always fully yours, but employer money may follow a vesting schedule. Under a four-year graded schedule you own 25% after one year and everything after four, so leaving early can forfeit part of it.
Does the calculator include taxes?
No. Traditional 401(k) contributions are pre-tax and withdrawals are taxed as ordinary income, so the projected balance is a before-tax figure. A Roth 401(k) is funded with after-tax dollars and qualified withdrawals are tax-free.
Why is the balance in today's dollars lower?
Inflation reduces what a future dollar buys. The calculator divides the projected balance by the inflation rate compounded over your years to retirement to show its purchasing power today.